Usage
Instance members can view aggregated or per-organization resource usage through the Instance Manager. There are two primary methods for viewing this information.
Aggregated Usage
Instance members can view aggregated payload, notebook minute, and device counts on a per-day or per-hour basis by navigating to the "Usage" screen in the Instance Manager subnavigation.
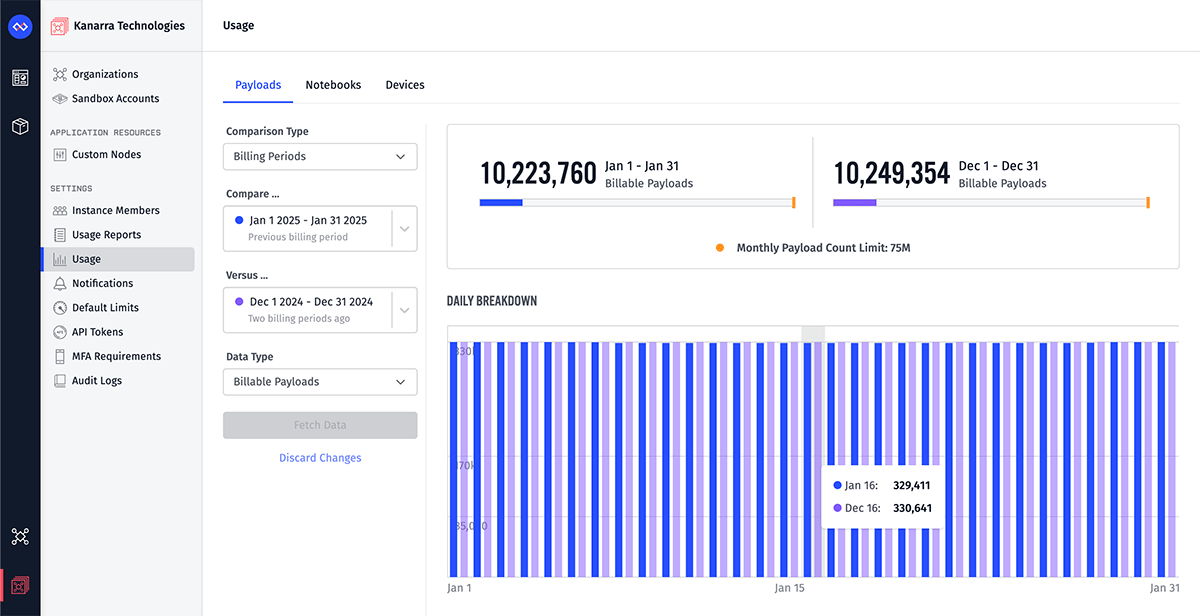
The interface is similar to viewing organization usage, except the data reflects usage across all instance organizations for the instance. However, static resource usage (workflows, dashboards, etc.) can only be viewed through a usage report.
Instance sandbox usage is not included in these metrics; the reflected values cover instance organization usage only.
Note: Though instance limits are displayed on the payload and notebook minute usage graphs, instance limits are not strictly enforced and the instance will continue to process payloads and notebooks when those limits are exceeded.
Usage Reports
Instance Administrators can configure and schedule usage reports to be delivered to a URL and/or email on a recurring basis. Usage reports contain resource consumption amounts broken down by organizations or by individual applications.
If reporting on organization resources, the resulting CSV will also include the current values of all organization tags.
Configure and Schedule Reports
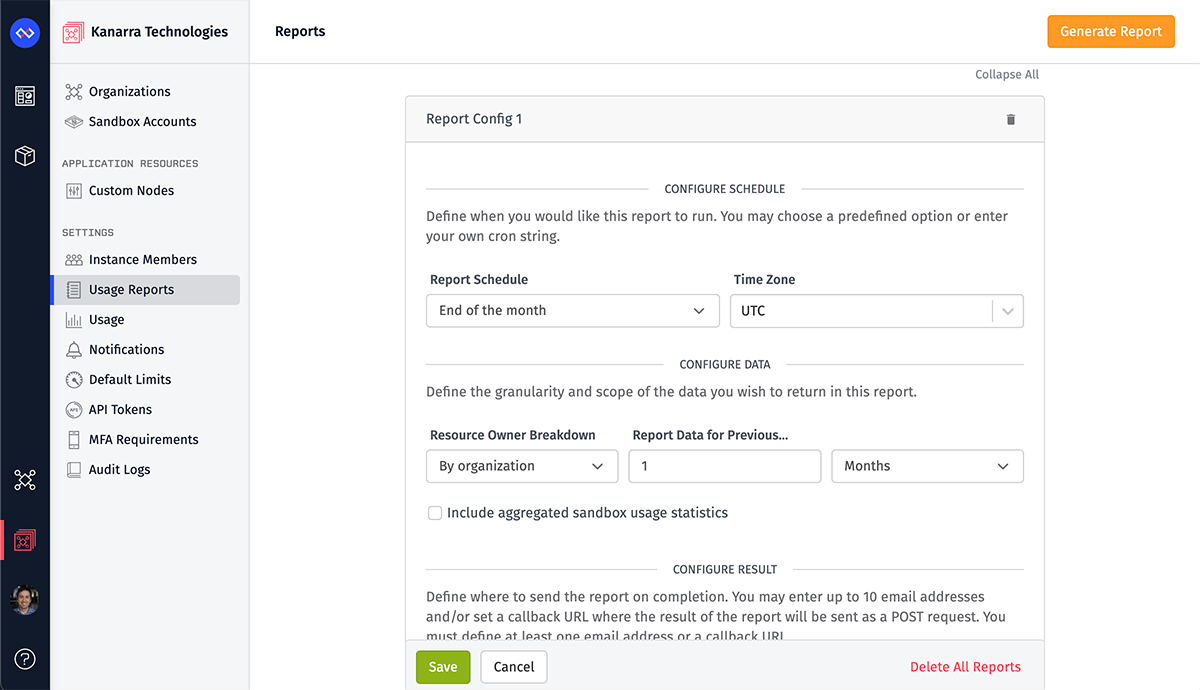
Users may access report configurations by navigating to the "Usage Reports" screen in the Instance Manager subnavigation.
Configuration Schedule
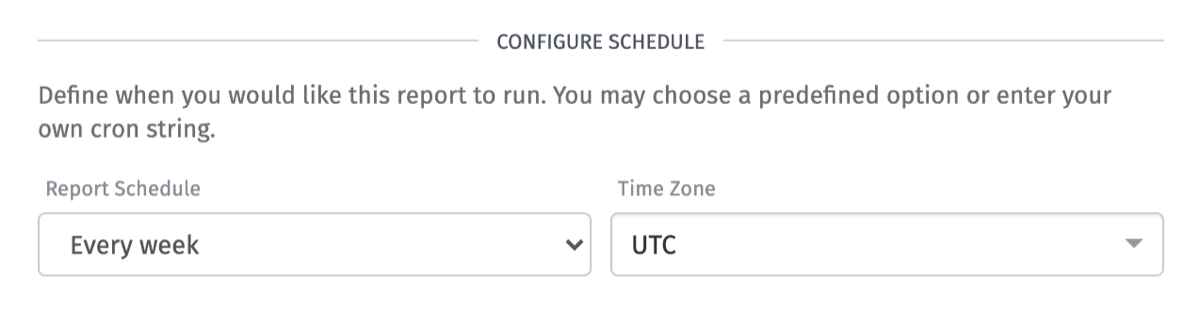
You receive these reports on a schedule of your choosing. You have the following options available to you:
- End of the month: Sends a report at the start of the first day of the month at 4 a.m. in the selected timezone.
- Twice per month: Sends a report on the 1st and 15th of the month at 4 a.m. in the selected timezone every month.
- Every week: Sends a report once every Monday at 4 a.m. in the selected timezone.
- Custom …: Allows you to enter a custom cron string to set a custom schedule. Aggregations take some time to roll up, therefore we recommend scheduling for a few hours after a day's end in the selected timezone.
Configure Data
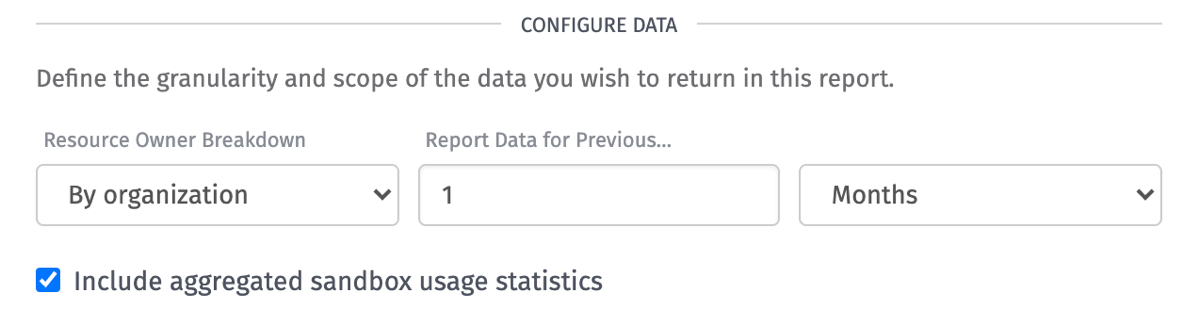
You may set the scope of your reports to either by organization or by application.
Reporting data for previous months allows you to get data as far back as 12 months. Reporting data for previous days allows you to get data as far back as 90 days.
The option to "Include aggregated sandbox usage statistics" allows you to see sandbox account usage amounts in your report. If you have multiple sandbox accounts, this option will combine the usage amounts from all sandbox accounts.
Configure Result
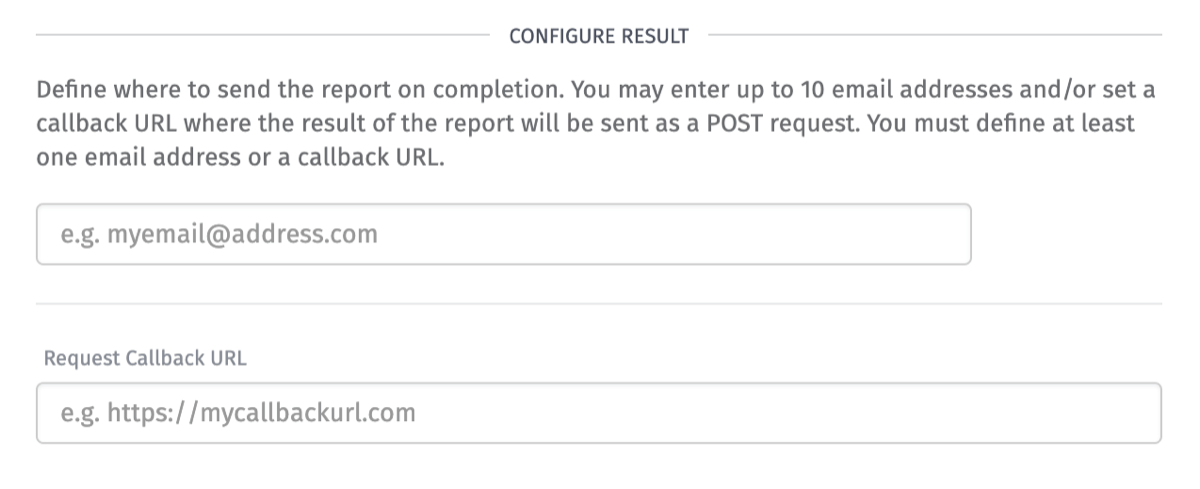
You can configure multiple reports delivered on various intervals and with different usage breakdowns. Each may be delivered to up to 10 email addresses and/or a callback URL. Email recipients will receive a URL where a CSV containing usage data can be downloaded; callback URLs will be via a POST request with the CSV URL in the body of the request.
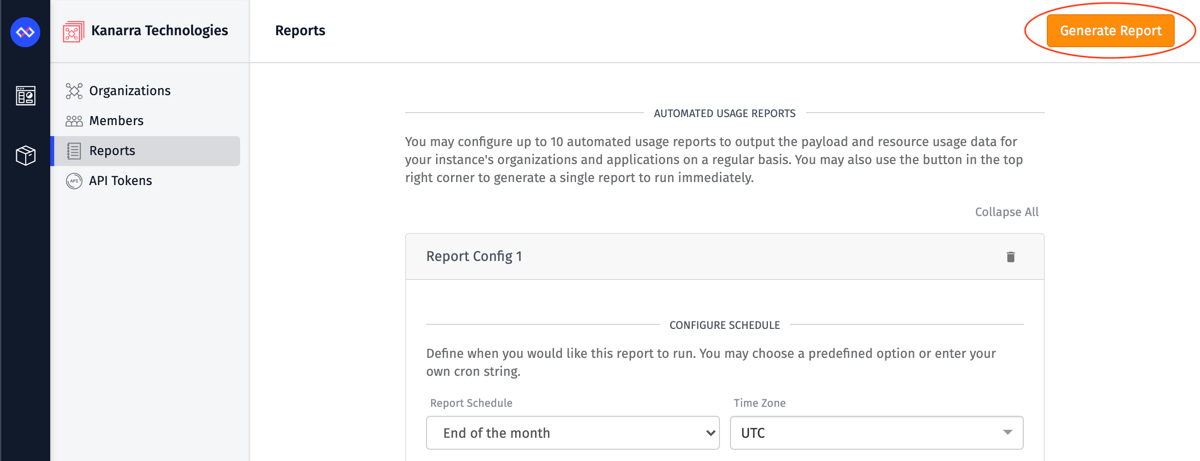
Generate One-Off Instance Report
As an Instance Viewer or an Instance Administrator, you may generate a one-off report by clicking on the "Generate Report" button located at the top right of the screen.
A Generate Usage Report modal will be displayed. The configuration options are very similar to Instance Report Configurations described in the previous section. There are a couple of differences.
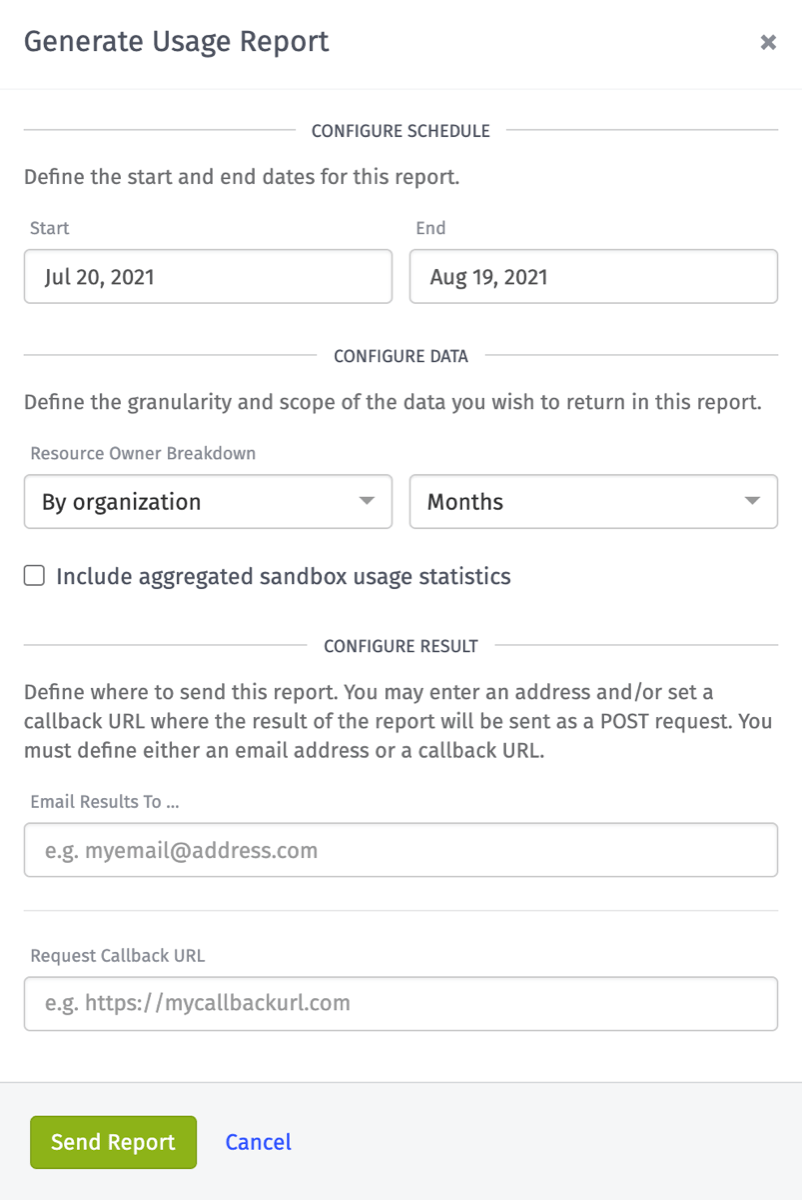
Instead of selecting a scheduled cadence of when to receive your reports, you set the start and end date range of the data you want your report to contain.
A maximum of 12 months can be selected from the end date when you set the current scope as Months. You can choose a maximum of 90 days from the end date when it is Days.
The final difference is that you can only send the report to one email address. Keep in mind that you can only generate one report concurrently per instance.
Was this page helpful?
Still looking for help? You can also search the Losant Forums or submit your question there.