Dashboards
Losant Dashboards provide a flexible and powerful way to display information relevant to your specific connected solution. Dashboards are helpful to see changes and patterns in your data over time, or even detect anomalies. One can even securely publish dashboards internally or externally.

Creating a Dashboard
A dashboard can be created at any time from the Dashboards tab, or from a few other places within the platform.
When creating a dashboard, you'll be asked for the following details:
Dashboard Name: You are required to name your new dashboard. The name can be changed at any time.
Description: Optionally, you may also provide a description of the dashboard.
Note that, should you choose to make your dashboard public, the name and description will be visible to those users.
Data Source: A dashboard can be scoped to data from a single application or multiple applications.
-
If you're creating a new dashboard from within an application, you won't be presented with a Data Source option - by default, the dashboard will be scoped only to the currently selected application.

-
If you're creating a new dashboard from outside of an application (such as from the
Dashboardstab, your personal Sandbox overview page, or an organization's overview page), you're required to select a Data Source. Note that you can only select an organization for which you have a member role of Collaborator or higher.
After filling out the form, click Create Dashboard to start adding blocks.
Adding Blocks
Losant supports many different blocks for visualizing various pieces of information. New blocks can be added to your dashboard by clicking the Add Block link at the top of the dashboard.

On the Add Block page, there are several options available to help you find the block that meets your needs.
If, for example, you already know the name of the block that you want to add to your dashboard, you can enter it directly into the search field. The block list will automatically update to return any blocks that are a match for your search term.
To the right of the search input are the options for changing how the blocks are sorted. By default, dashboard blocks on the page are sorted with the most popular blocks appearing first in the list. By changing the selected sort option, it is also possible to view blocks in alphabetical order or by category.

Application Access
Most dashboard blocks require an application from which to fetch their data. The application(s) available to a dashboard's blocks are determined by the Data Source selected when creating the dashboard.
-
Dashboards owned by a single application may only pull data from that application.
-
Dashboards owned by an organization may only pull data from applications owned by that organization.
-
Dashboards owned by a user's Sandbox may pull data from any application owned by the user or any organization the user is a member of. This allow users to build their own customized views from various projects across multiple organizations.
Editing Dashboards
Dashboard blocks can be resized and rearranged to any layout that fits your needs. To move a block, grab the block's header bar with your mouse and move it around the dashboard. To resize a block, grab its bottom right corner with your mouse and expand or contract it vertically or horizontally.

Edit Block Configuration
Block configuration – the settings that handle the data displayed and the style of its presentation – can be edited any time after initial block creation. To edit a block, hover your mouse over the block's title bar and click the "gear" icon. This will open a menu with an "Edit Settings". Clicking that option will take you to a screen where the configuration can be changed.

Each block type is different; check out each type's entry in the documentation for details on editing its respective configuration.
Clone an Existing Block
If you have multiple blocks that have similar configurations, it may be quicker to start from one of the blocks, make a few edits and then push a new block to your dashboard. In these cases, cloning an existing block can save time.
To clone a block, click the "Settings" (gear) button in the top right corner of the block you want to clone. From the dropdown that appears, select "Clone Block." A modal will open that will allow you to choose which dashboard you'd like to clone into. If the dashboard you clone into belongs to a different application, further configuration may be required.
Block Actions Menu
When hovering over a block, a "gear" button will appear on the upper right. This button toggles a menu containing various actions available for the block.
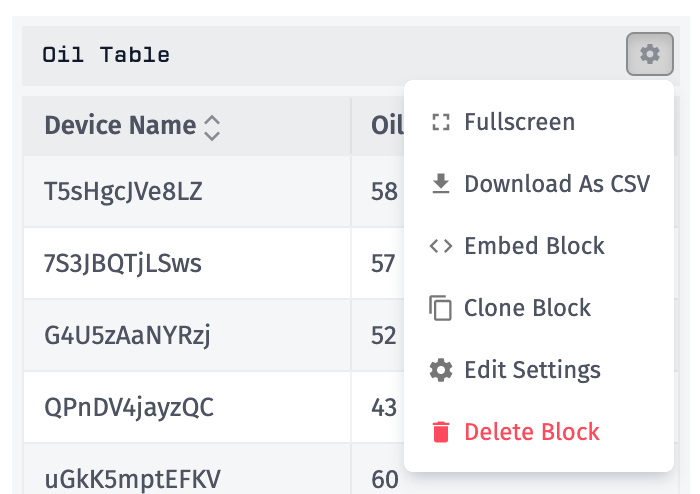
The available actions can vary based on your permissions, the block type, and the current state of the dashboard. The following is the full list of possible actions:
- Fullscreen - Expands the block to fit the screen's dimensions. Not all devices support this feature (smartphones and most tablets specifically), and if your device does not allow fullscreen display, this option will not be visible.
- Lock/Unlock - Available on Input Control blocks, to lock or unlock the controls on the block.
- Download As CSV - Available on Device State Table blocks, and allows you to download the table as a CSV.
- Refresh - Available only when a block is embedded, and allows the viewer to manually refresh the data.
- Embed Block - Available on pubic dashboards, allows you to embed the block in another website.
- Clone Block - Allows you to clone the block to the current or a different dashboard.
- Edit Settings - Allows you to edit the configuration for the block.
- Delete Block - Allows you to remove this block from the current dashboard.
Display Settings
Within the dashboard settings menu, there are a couple options for changing the dashboard's display style ...
- Switch to Dark/Light Mode flips the color scheme to a darker or lighter style depending on which is currently being applied. This is stored as a user-level preference, so switching to the dark theme on one dashboard will cause other dashboards you visit to also be displayed in the dark theme until you switch the setting.
- View/Exit Fullscreen enables or disables hiding the Losant header and footer and expanding the dashboard to fit the screen's dimensions. Not all devices support this feature (smartphones and most tablets specifically), and if your device does not allow fullscreen display, this option will not be visible.

Auto Refreshing
Dashboards by default will automatically refresh the data every 60 seconds. You can pause the refreshing at any time by clicking the pause button in the dashboard toolbar. You can also force the dashboard to refresh by clicking the refresh button. You can also control the refresh interval under the settings for the dashboard.

Global Duration and Resolution
Every dashboard has a defined global duration and resolution, which can be referenced in block configurations to provide a universal view of data over a given time range and level of granularity.
Utilizing Timing Variables
In dashboard block configurations that require a duration and/or a resolution to be defined, you may choose to use the global duration or a block-specific duration. When choosing the global duration, the block automatically also utilizes the global resolution. The resolution cannot be independently changed at the block level.

You may also utilize the global values using the Handlebars templates {{dashboard.duration}} and {{dashboard.resolution}} when constructing advanced queries or third-party API calls in the Custom HTML Block.
Much like context variables, these values must be explicitly utilized in each block configuration to have any effect on a block's display; in other words, if a block is displaying data for a specific duration and not for the global dashboard duration, changes to the global duration will have no effect on that block.
Setting Timing Variable Values
The default values for the dashboard duration and resolution are set in the dashboard configuration itself. When explicit values are not provided for the global duration and resolution - such as when configuring an Experience Dashboard Page - the default values will be utilized.

Using the dropdown menu in the dashboard toolbar, the global duration and resolution can be temporarily changed to compare different data sets across all dashboard blocks that utilize the timing variables. The values default to the default values configured on the dashboard itself.

This method allows for quick comparisons across different durations and resolutions without reconfiguring the dashboard itself or any blocks. Changing these values does not change the default timing values set on the dashboard; in other words, changes made in this menu will revert to the dashboard default values if the user leaves the dashboard and returns in another visit.
Viewing Past Dashboard States
By default, dashboards show values as of the last time data was fetched from Losant. To view the state of your dashboard blocks at a given point in time, open the Time Jumper dropdown and select the "Jump to a specific date/time" option. After choosing a past time, clicking "Update Time" will cause the dashboard to refresh and display each dashboard block as it appeared at that moment.

It is also possible to jump backward and forward in time simply by clicking the arrows on either side of the time jumper dropdown. This allows for quick perusing of dashboard states as they progressed over a period of time. By default, the arrows jump 60 minutes forward and backward, but this value can be changed in the Time Jumper dropdown. The arrow jump amount is stored locally on your browser and will be maintained across different dashboards. If you have chosen to view a past dashboard state, a third arrow will appear allowing you to jump directly to the current time.

A few things to note when viewing past dashboard states:
- The following dashboard blocks do not update when viewing a past dashboard state (meaning, they continue to reflect the "most recent data" state of the block): Input Controls, Event List, Device List, Workflow List, Application List, Dashboard List, External Website
- When viewing a past state, the dashboard will cease to refresh data on a regular basis.
- Each individual block will honor its specific duration settings regardless of the selected date. For example, when viewing 10:00am on June 1, 2016, a Time Series Graph configured to show the last hour of data will display data from 9:00am to 10:00am of that same date. Meanwhile, a Gauge Block set to display a mean aggregation of data collected over the past four hours will show the aggregated value of its attribute as collected from 6:00am to 10:00am that morning.
- If you attempt to go forward in time past the current date/time, the dashboard will automatically revert to the "Display most recent data" option and the ability to go forward from that point will be disabled.
Live Stream Blocks
Live Stream dashboard blocks automatically update in real time when new data is available, instead of waiting to update when the dashboard's refresh timer resets.
Live streams only present the live, incoming raw data for the device(s) they are configured for. You are unable to perform aggregations on that data (i.e. mean, max, min, etc.). Access to past states is also unavailable.
Live stream blocks present a "Connected... Waiting for Data" message until the device(s) report state data for the first time after the block loads. This messages means that the dashboard has successfully connected to the Losant live stream of data for the block; it does not correlate to device connectivity for any device represented in the block.
Dashboard Access Control
Dashboards have three levels of access:
- Private dashboards are only accessible to members of your organization (if it is an organization-owned dashboard). Private dashboards may also be presented to your application's experience users through a dashboard page.
- Public dashboards can be seen by anyone who has the dashboard URL, regardless of whether that person is logged in to a Losant account. This is great for sharing public data, but remember that any data exposed in a public dashboard is public and is accessible by anyone. Do not make your dashboard public if it contains any private or sensitive data.
- Password-protected dashboards allow anyone with the URL and a password you define to view the dashboard. (Members of your organization may view the dashboard without entering the password.) This adds some protection to your dashboard while still making it easy to share with people who do not have Losant accounts.
You can manage a dashboard's access control under the "Access" tab of the dashboard's "Settings" page.

Clone a Dashboard
You can clone a dashboard into the same application, a different application, or into an organization (multi-application dashboard).
Important: Unless you are cloning in the same organization or application, many of your dashboard blocks and context variables will require updates before they are functional again.
Clone a dashboard by navigating to the Clone tab within the dashboard settings page.

Embedding In Other Sites
You can display your Losant dashboard, or a collection of blocks from one or more dashboards, in another web page. Losant provides JavaScript snippets to embed those resources into an HTML document.
NOTE: Dashboard access control must be set to "public" to embed into another site. The following blocks will not display any data on public dashboards or to non-authorized users when embedded:
Application ListDashboard List
Embedding Entire Dashboards
From your dashboard's settings page, click "Embed Dashboard" in the left column. This will bring you to a page where you can configure your embed options, such as:
- Width in CSS units (default: 100%)
- Height in CSS units (default: the height of dashboard currently)
- Theme (default: Light)
- Fetch Data Every ... (default: current dashboard setting)

This will generate a code snippet, which you can drop into any HTML document at the place where you want the embedded dashboard to appear.
An embedded dashboard only includes the dashboard's blocks, not its title, configuration buttons or Losant header and footer. The image below is a screenshot of a dashboard. This is the only content that appears when a dashboard is embedded.

Embedding Single Blocks
You may only embed a single block if your dashboard's access control has been set to public. To get an embed code, hover over your dashboard block and click the "gear" icon in the block header, and then the "Embed Block" option in that menu.

This will display a modal where you can set the block's width, height and theme properties. For your width and height, make sure to enter a valid CSS length attribute (%, px, em, vw, etc.).
Email Reports
You also have the option to email reports based on a dashboard at recurring intervals. You can do this under the "Reports" tab in the dashboard settings:

You can configure up to 10 recurring reports, each containing a set of email addresses to receive a PDF report of the dashboard at a regular interval. Each report allows you to individually choose a time of day and the days of the week to send the reports, and also the subject and message of the emails. You may also specify a specific context to render the report against.

In the above example, a report will be emailed every Thursday at 10:10am Central Time to the addressed recipient. The resulting email will include a link to a PDF report of the dashboard at that time rendered against the context provided, similar to the example below:

Non-Recurring Report
A non-recurring report is a one-time report of the current dashboard view - this includes the currently selected theme, time, and context of the dashboard. You can request a report by clicking "Generate Report" in the dashboard popup settings:

This report method can send a historical view of the dashboard and allows you to configure email addresses, timezone, subject, message, and context just like recurring reports, but sends only once. Since non-recurring reports don't send on a schedule, the timezone field is used only for the time displayed on the report. Shortly after submitting, your recipients will receive an email with a link to the dashboard report.
Was this page helpful?
Still looking for help? You can also search the Losant Forums or submit your question there.