Bar Chart
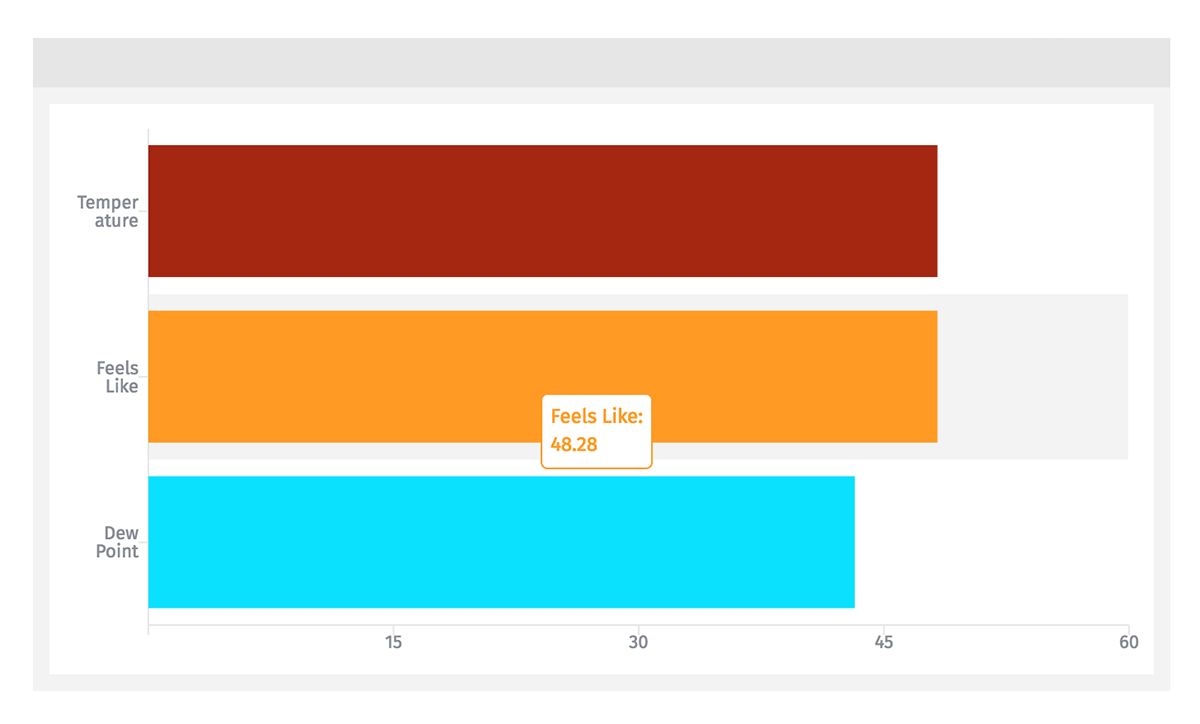
The Bar Chart allows you to display proportional data across one or more devices.

Configuration
Configuration for the Bar Chart is broken up across multiple sections.
Data Type

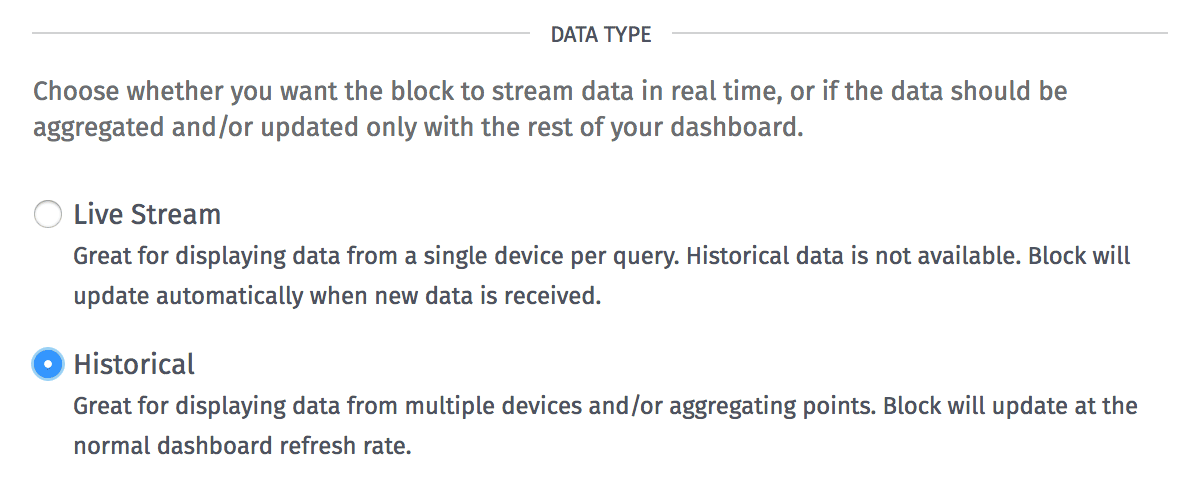
The Bar Chart can display points as a live stream (re-rendering the chart every time a data point hits the platform) or as a historical chart. Each style has its own advantages:
- Live stream charts provide feedback with more immediacy than historical charts, as they do not require a dashboard data refresh to populate with new data. If one of the block’s segments references multiple devices by ID or tag, the block will update anytime any of those devices reports state for the chosen attribute. For this reason we recommend one device per segment when building live stream blocks.
- Historical charts allow for data to be aggregated according to a number of rules (based on time durations, mathematical functions and the combination of data from multiple sources), and they also allow for viewing past dashboard states.
Duration
Next, choose a Duration of time that the block’s data segments should cover. Select “Last received data point” to always return the last point matching each segment query, or any time period up to 180 days to return aggregated data within that time period. (This option is removed when “Live Stream” is selected for the block’s data type.)

Axis Configuration
Next, define the properties of the X axis. All are optional, and each input accepts string templates and can reference the values of context variables or the dashboard’s default render context.
- Axis Label: The label to place beneath the axis, which should describe the data being displayed in the chart. If not provided, no label is present.
- Min: The bounds of the left edge of the chart. Segment values that are less than the provided Min will fall off the left edge of the chart. If provided, this value must be less than Max (if provided) and, if a variable is used, it must resolve to a number.
- Max: The bounds of the right edge of the chart. Segment values that are greater than the provided Max will fall off the right edge of the chart. If provided, this value must be greater than Min (if provided) and, if a variable is used, it must resolve to a number.
- Format: A D3 format string for formatting the ticks along the X axis, as well as the values that display in the graph’s tooltip on hover.
Block Data
Finally, define multiple segments to be compared against one another in the chart, with each segment representing a bar on the chart. Each segment takes the following parameters:

- Device: A device query for selecting one or more devices whose aggregated data should be returned for the segment.
- Attribute: The attribute whose value should be returned. Depending on the chosen aggregation method, the selected attribute may have to be of the “Number” type.
- Aggregation: The aggregation method to apply to the raw points returned by the segment. This may not be applicable depending on the block data type, duration, or number of devices returned.
- Series Label: The label to use for this segment.
- Color: The color to apply to the segment of the bar chart.
-
Expression: (optional) An expression to apply to the raw returned data, which can be used to transform the result that is applied to the segment. If an invalid expression is provided, the data point reverts to its raw value. In addition to the default render context, the following variables are available within the expression …
{{value}}: The raw value of the data point.{{time}}: The time of the corresponding data point in milliseconds since Epoch.{{ctx.VARIABLE_NAME}}: The value of a given context variable.
Was this page helpful?
Still looking for help? You can also search the Losant Forums or submit your question there.
