Data Visualization Workshop

Introduction
Welcome to your workshop on data visualization! The purpose of this workshop is to give you real, step-by-step instructions on how to accomplish and use most of the tools we covered throughout the course.
This workshop builds on the Course Three Workshop and will guide you through creating dashboard blocks and showing you how to use context variables.
Let’s begin.
The Story
First, recall the story of the application we are building:
Embree is launching an initiative to adopt IoT and offer new capabilities to their customers. Currently, Embree produces water pumps for industrial use cases like mining, construction, and oil & gas. Their goal is to gain deeper insight into the pumps and provide more value to their customers.
To begin the new initiative, the Embree team decided to start with a proof of concept, which will enable them to solve a small, useful problem to get results faster. For this first project, Embree wants to take one of their existing pumps and send the data it’s collecting, like flow rate and temperature, to the cloud.
To build this proof of concept, they chose to use Losant. They chose Losant because the user experience would allow them to build this proof of concept in no time and they could easily build new applications with the insights gained.
Currently in our application, we already have a device that represents our water pump with the following attributes:
- Battery Voltage
- Valve Status
- Flow (liters per second)
- Temperature
- RPM
To visualize data in the last workshop we used the Data Explorer:
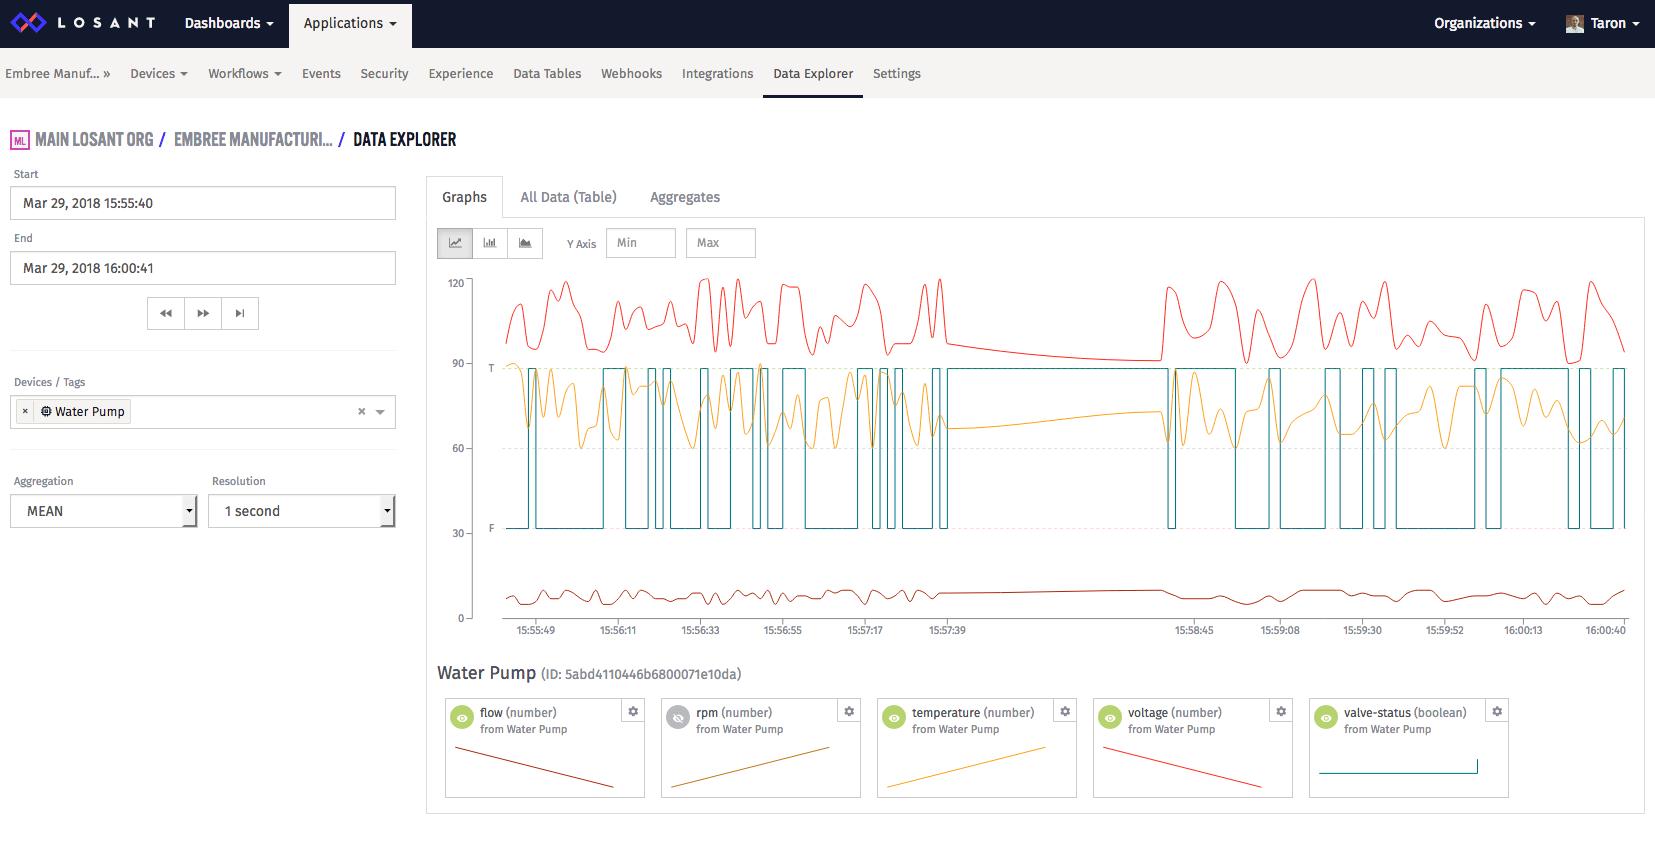
The Data Explorer is great if we want to quickly view and analyze data. But, creating a dashboard provides more features like different visualizations, reporting, sharing, etc.
Before we can create a dashboard, we need some data.
Part One: Building the Dashboard
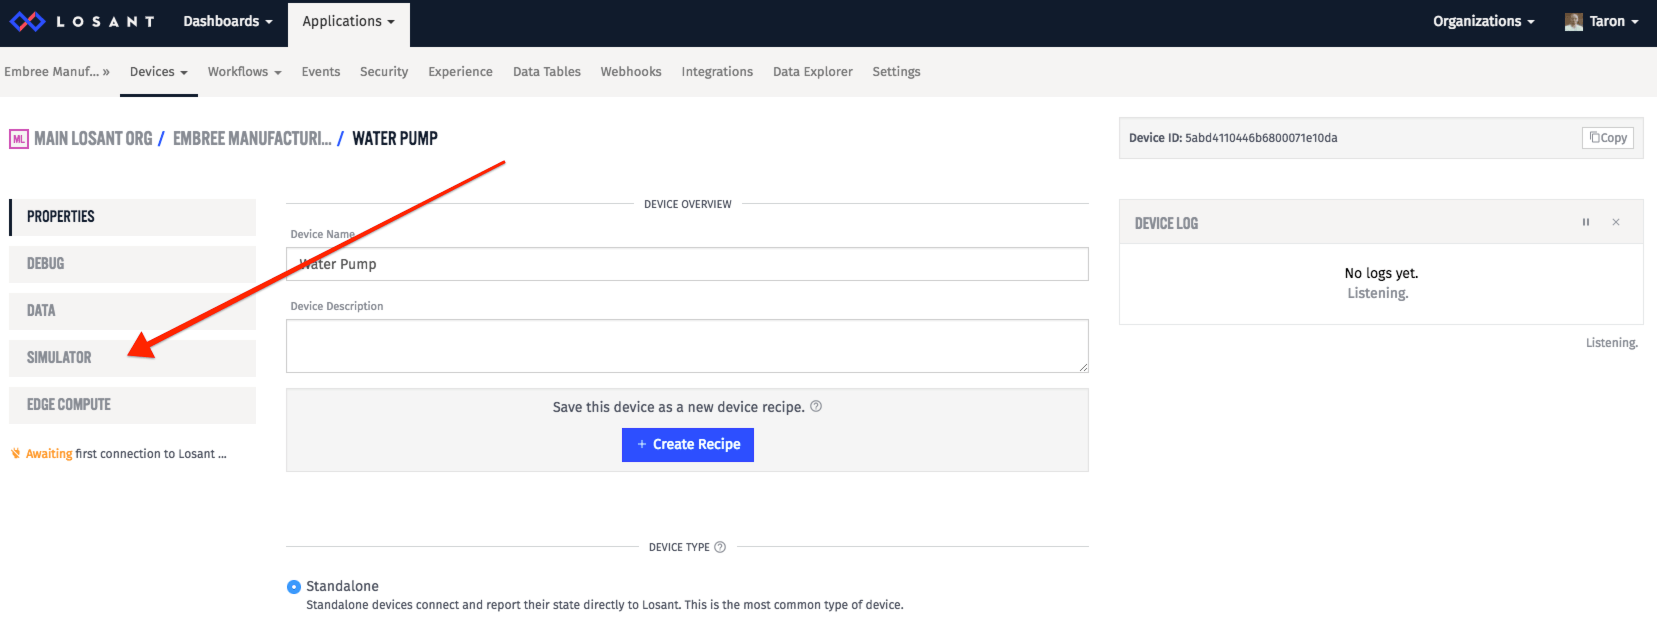
Simulate Data
Open up the Device Simulator. If you open up the device page, on the left side, you'll see the simulator.
Next, set the simulator to generate random values for all of our attributes. To help you follow along, please use the following values:
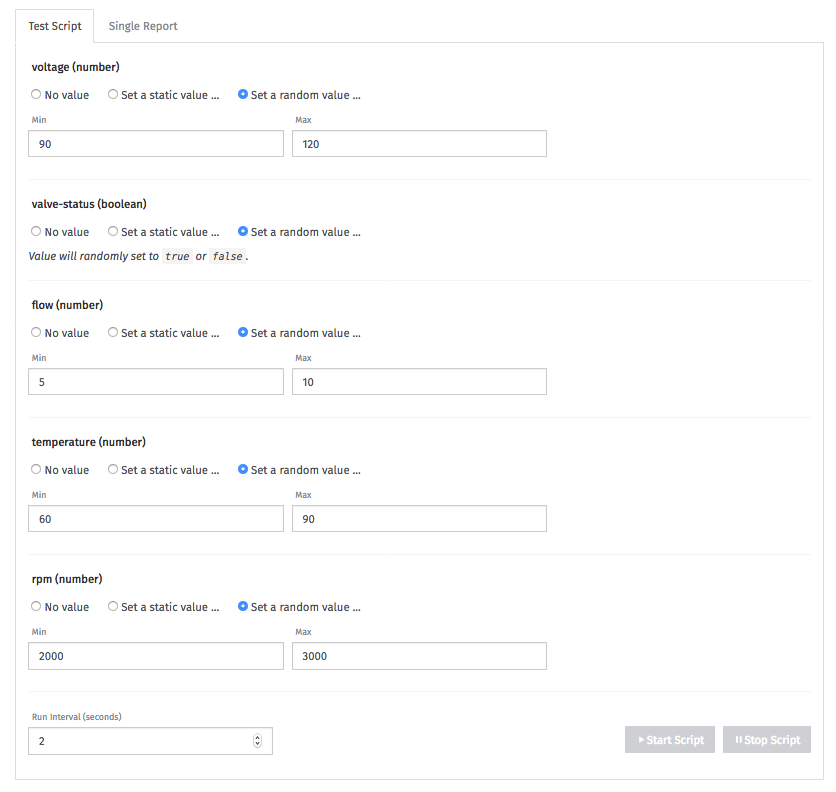
Remember, the simulator is using your browser window as the device. So, you must leave this browser window open for your device to simulate data.
Now that we have a device that’s generating data, open up a new tab and let’s create a dashboard.
Create a Dashboard
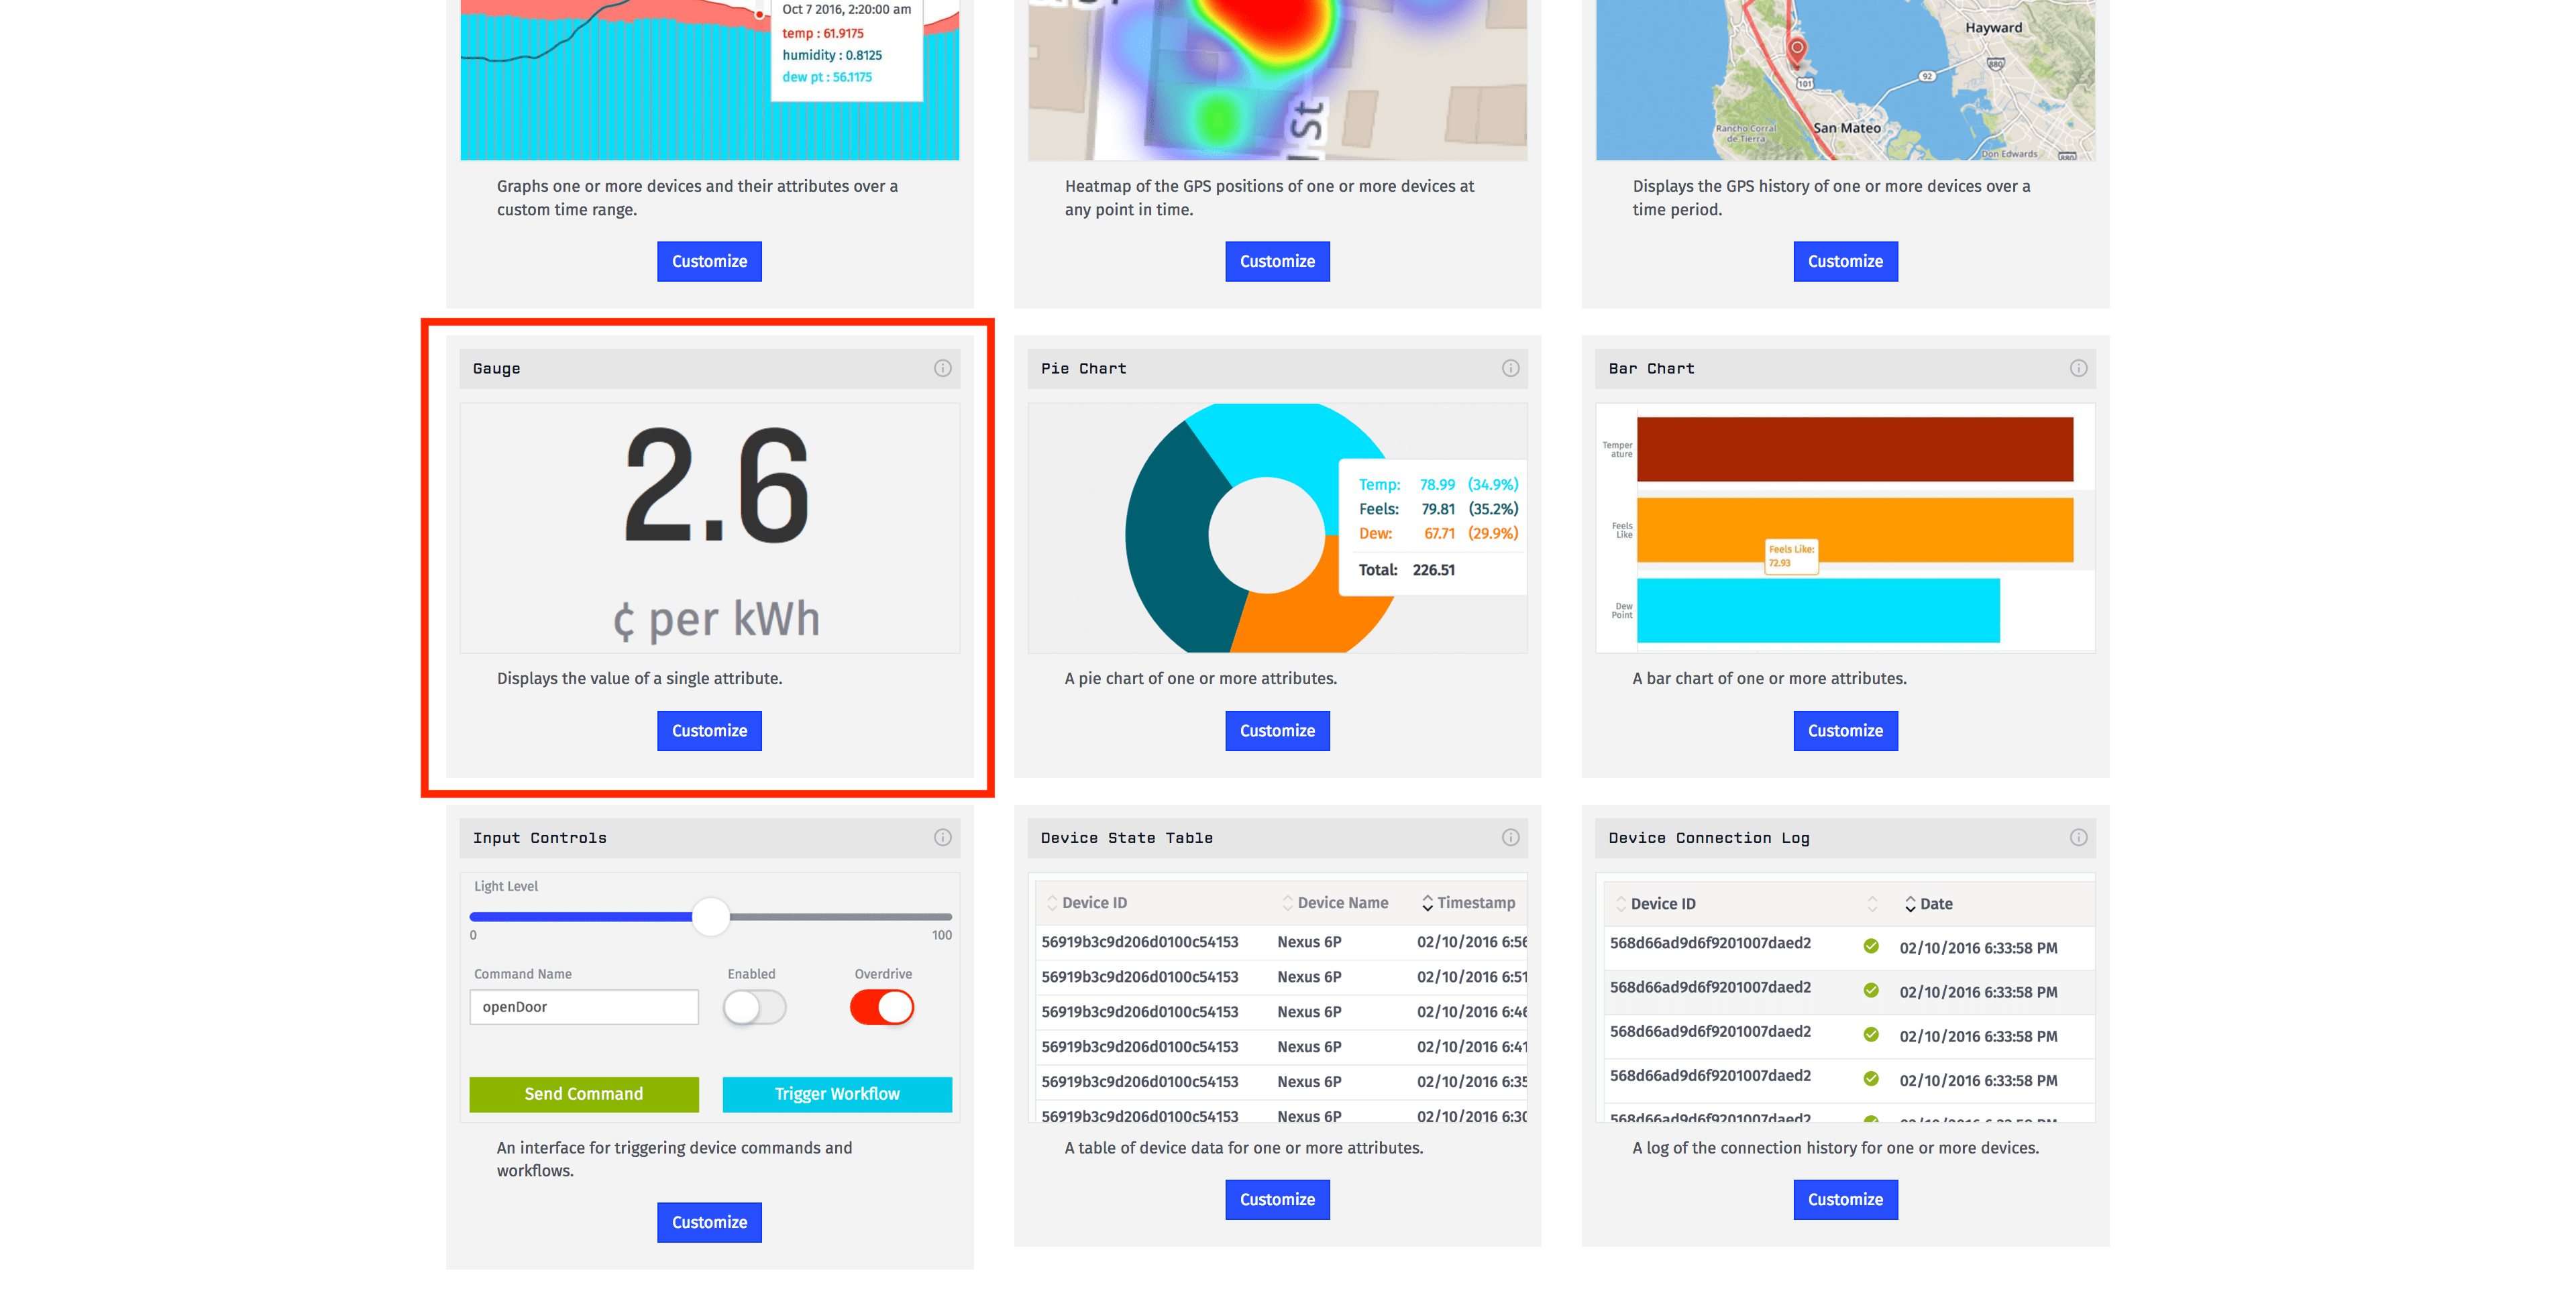
We provide many visualizations to best show your data for the questions you are asking about your data. For this example, here is what we can do:
Voltage, flow and temperature can be represented with a Time Series Graph, mostly because we want to see changes in the data over time.
RPM can be represented with a Gauge Block; mostly because we are concerned with its current value within a range.

Valve status can represented with an Indicator Block. We want to use this block because we can create a visualization to show us the current status of the valve and a corresponding background color (green for on and red for off) to clearly see the status of the valve.

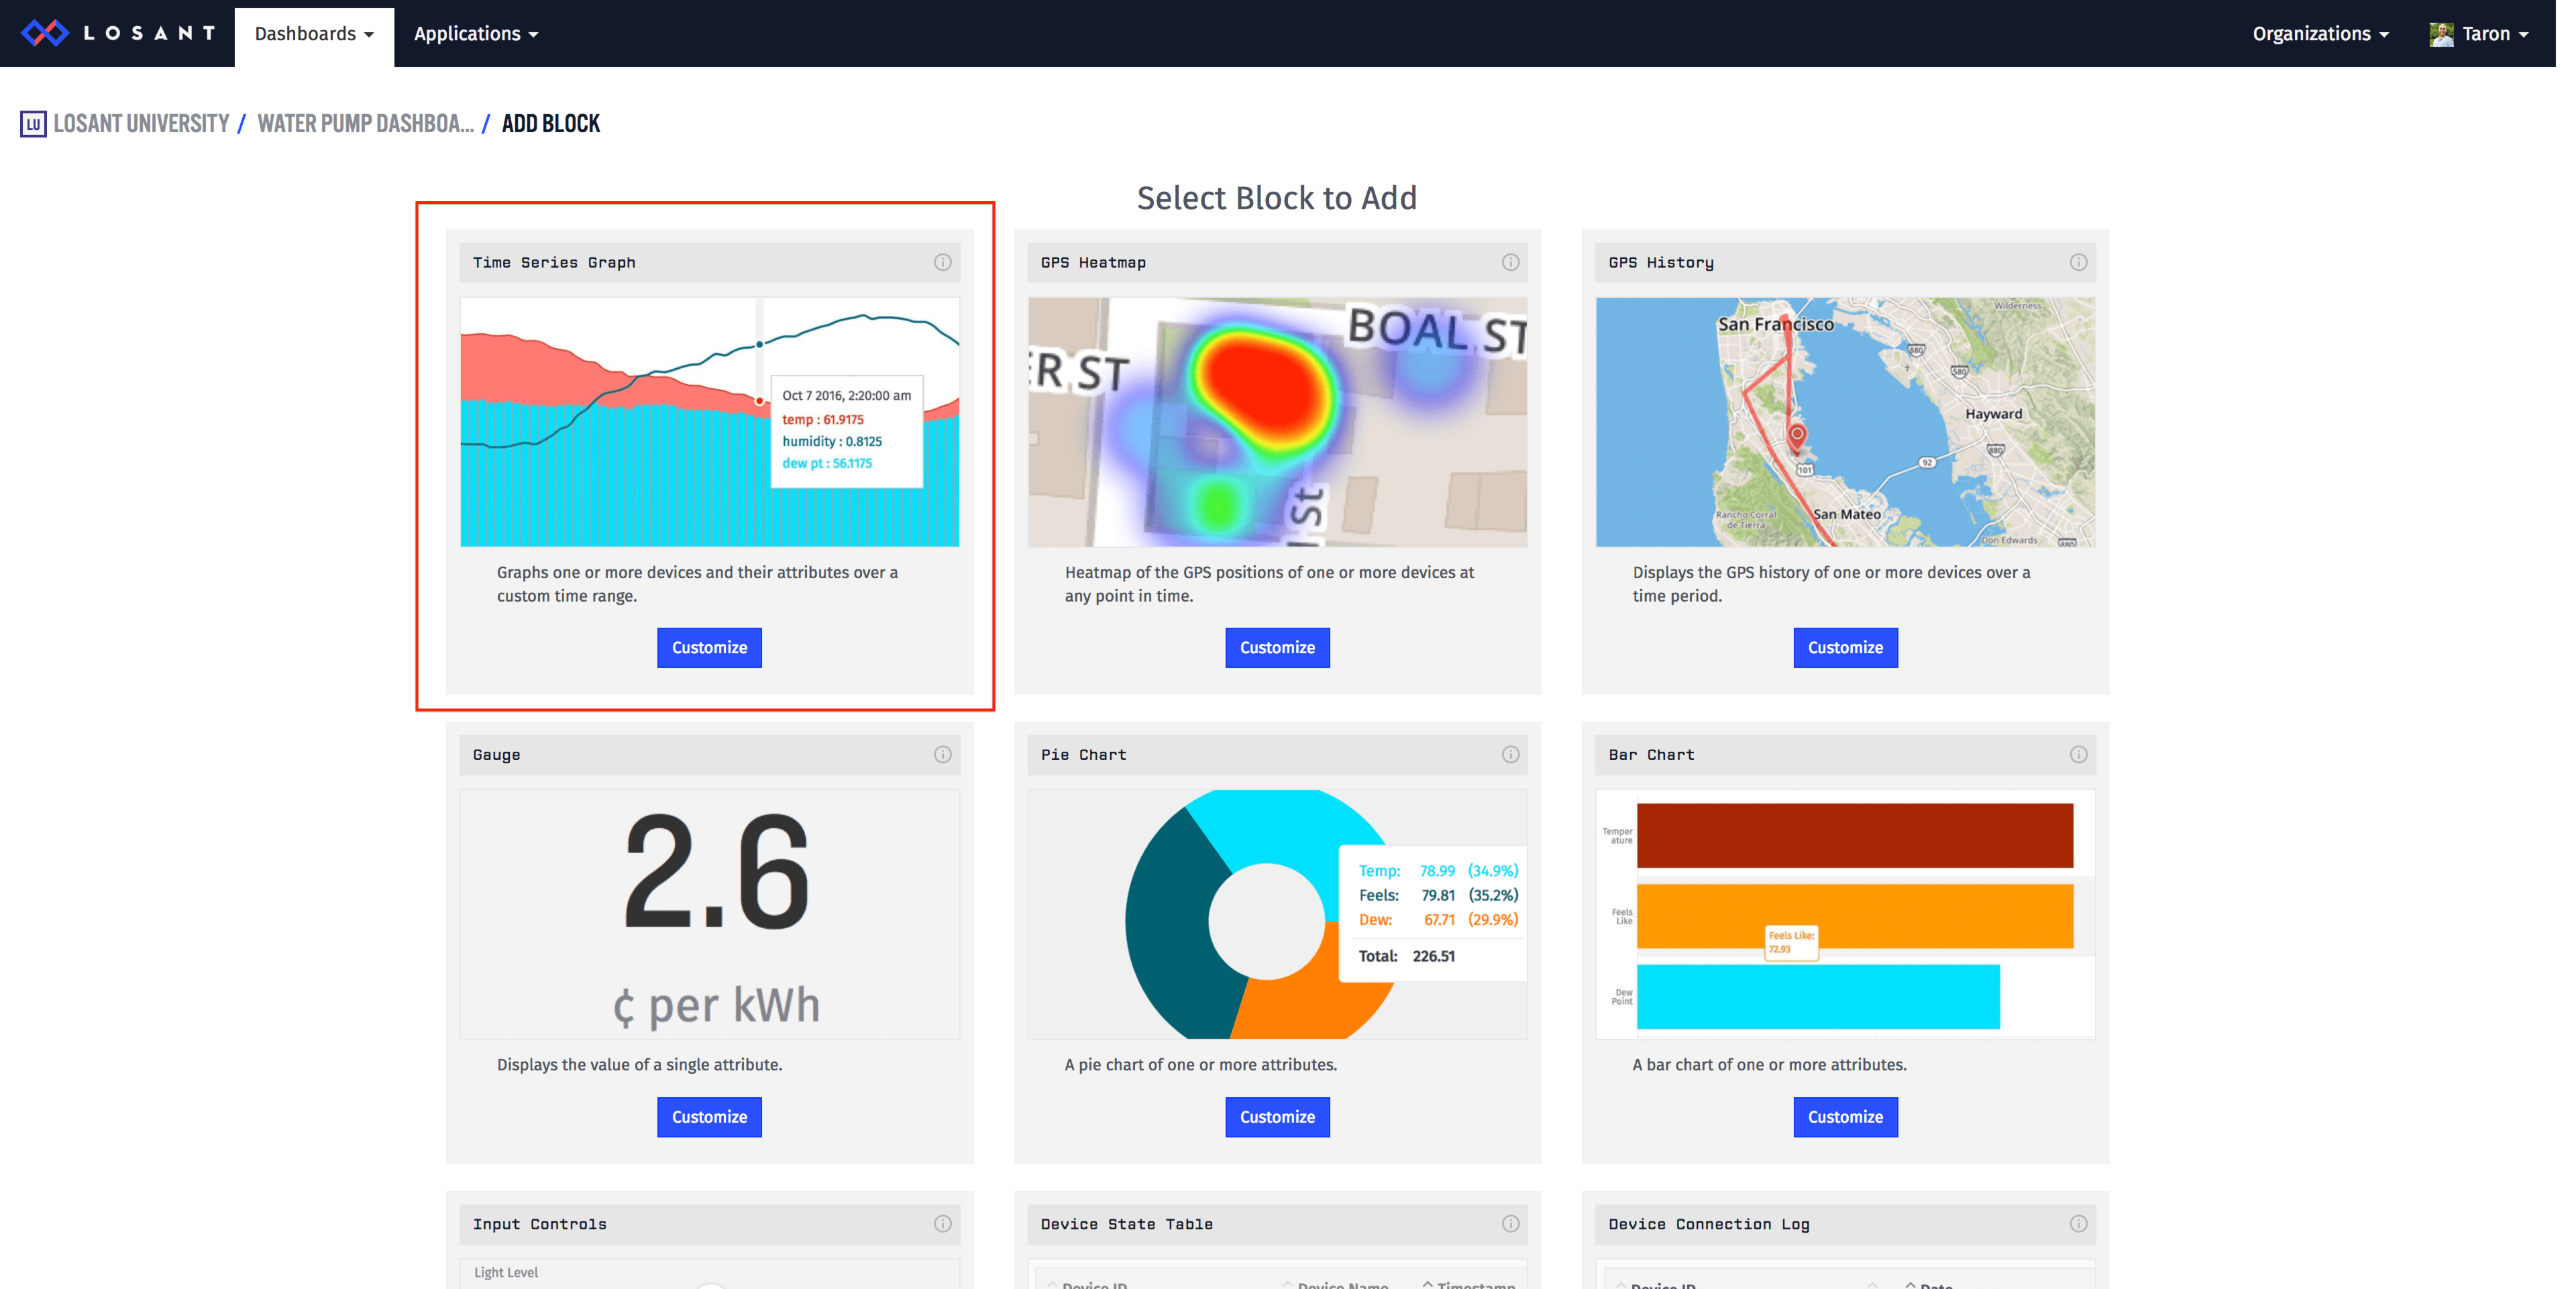
To get started, let’s add our Time Series Graph.
Adding a Time Series Graph
On the “Add Block” page, click the Time Series Graph.
First, we must give our block a name and choose our application. This application needs to be the application that contains our pump device.
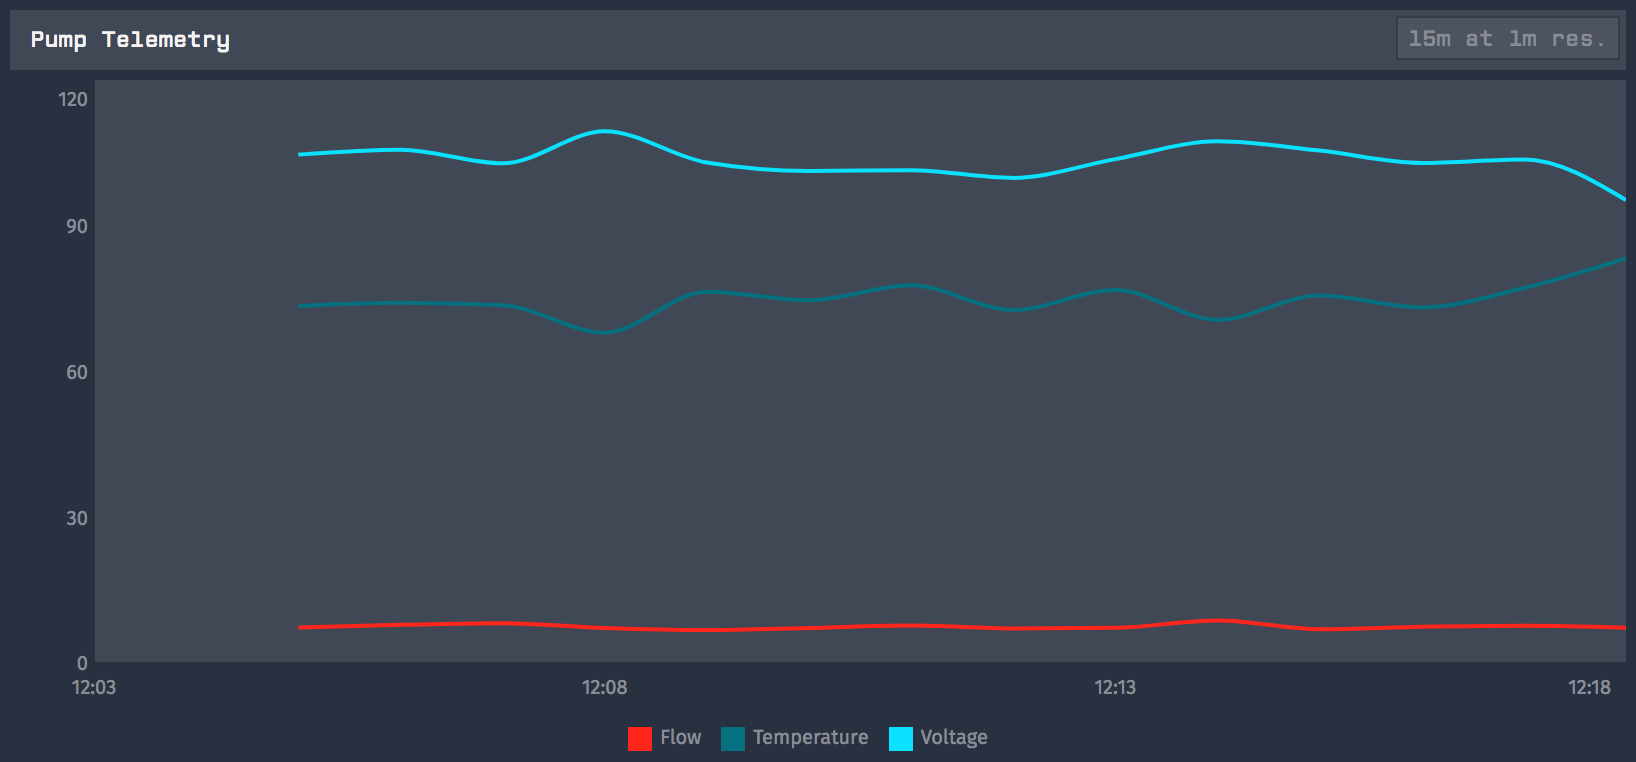
Next, let’s set our block to be “Historical” and the duration and resolution to “15 minutes” and “1 minute” respectively.
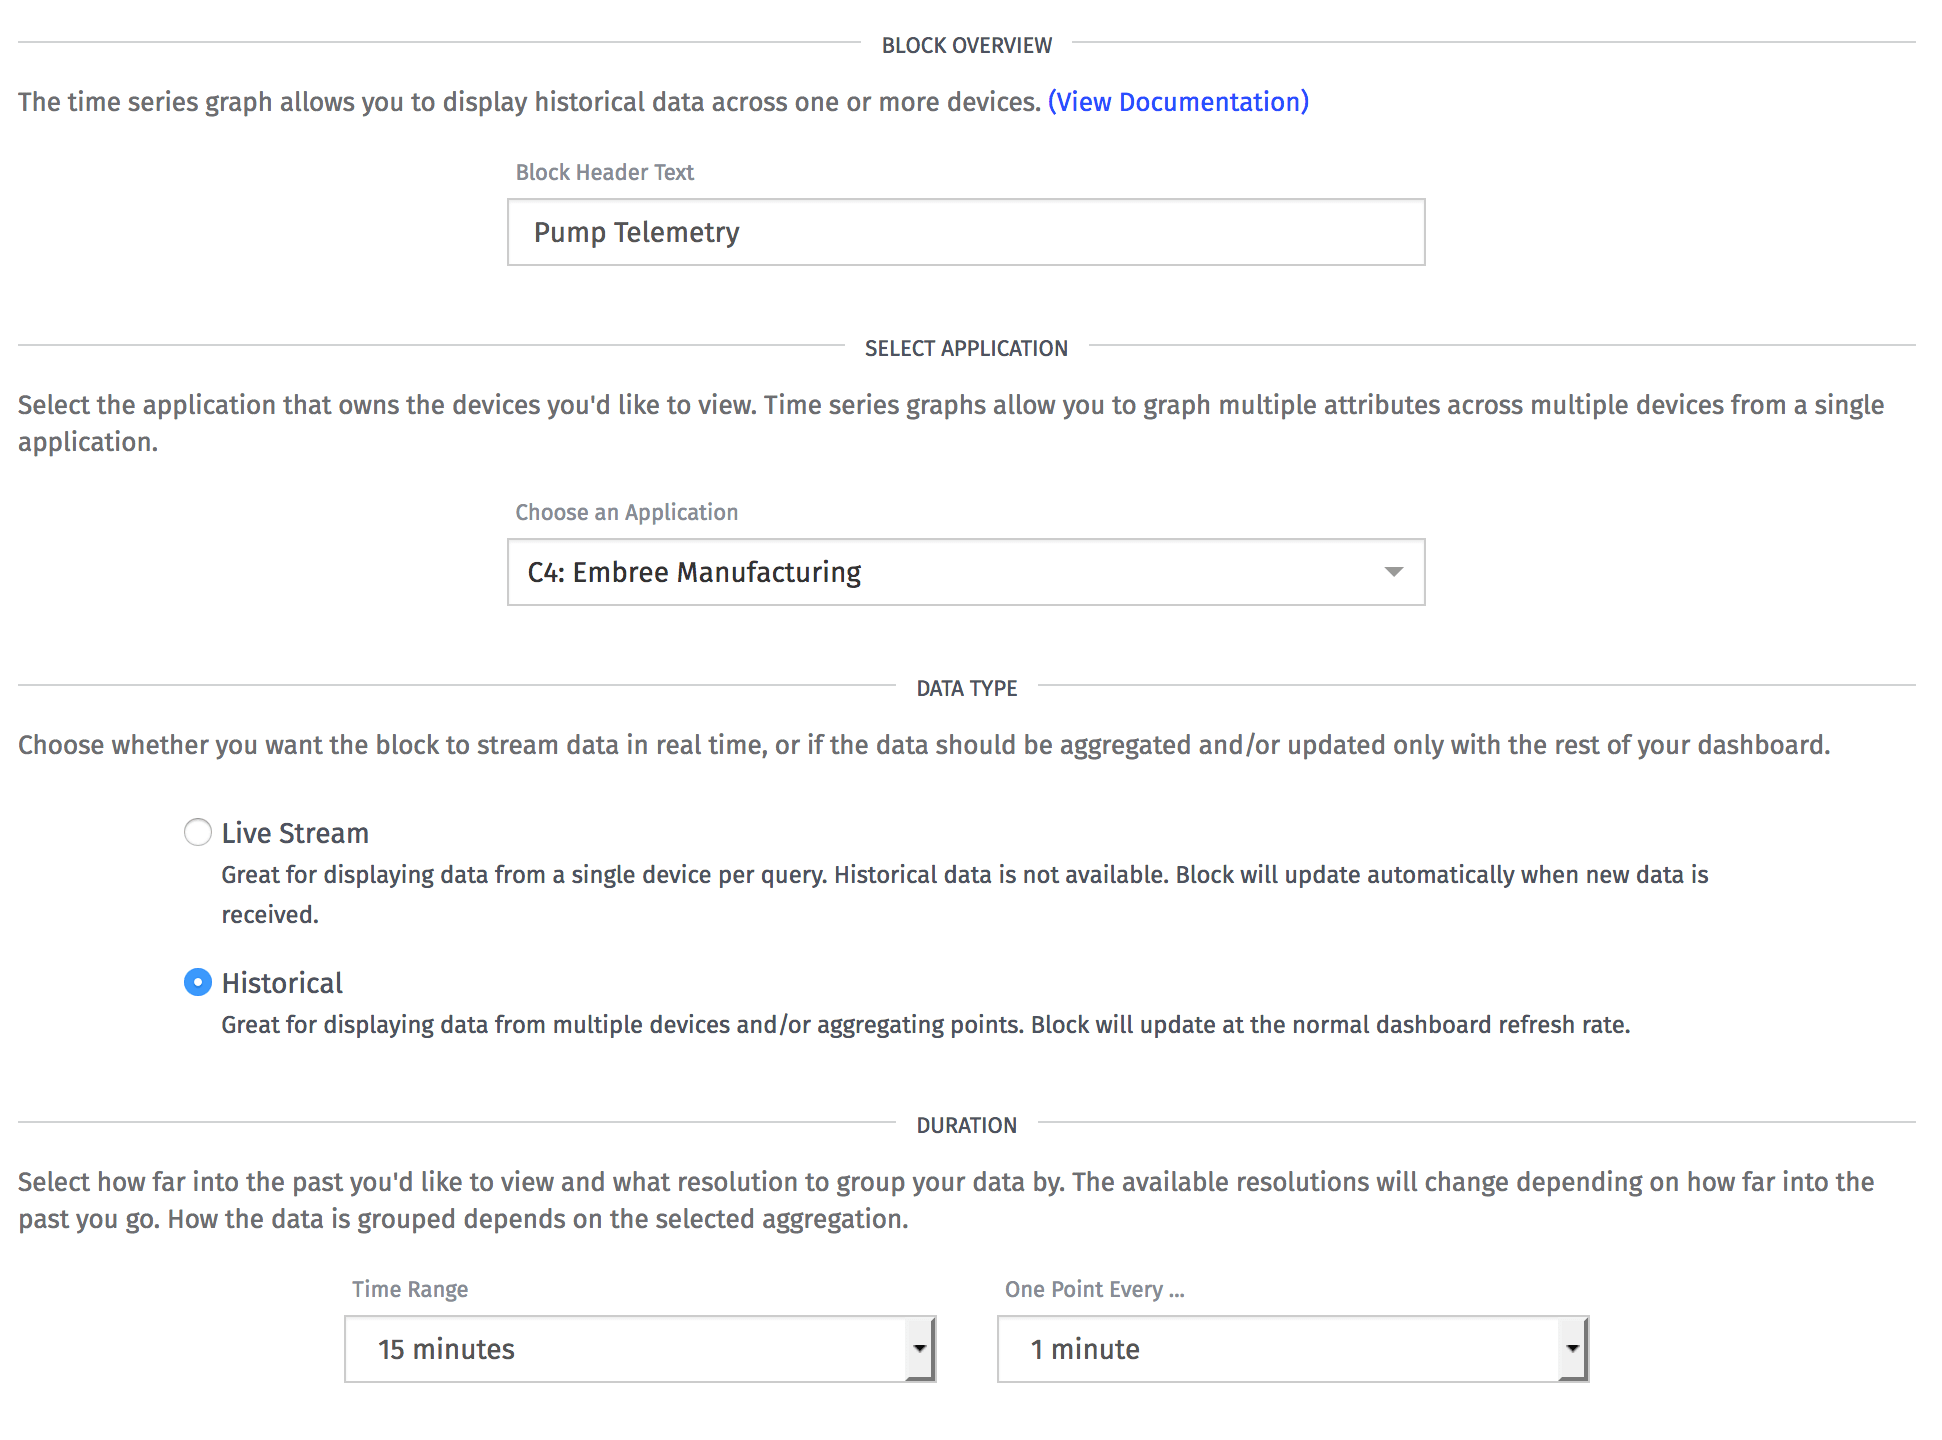
The simulator is set to generate data every two seconds. So, by choosing a resolution of one minute, each data point on the block will represent an aggregated value of 30 data points (data will be reported 30 times, or every two seconds, within a one-minute interval). We will have the option to select the aggregation method below.
Next, configure the device data.
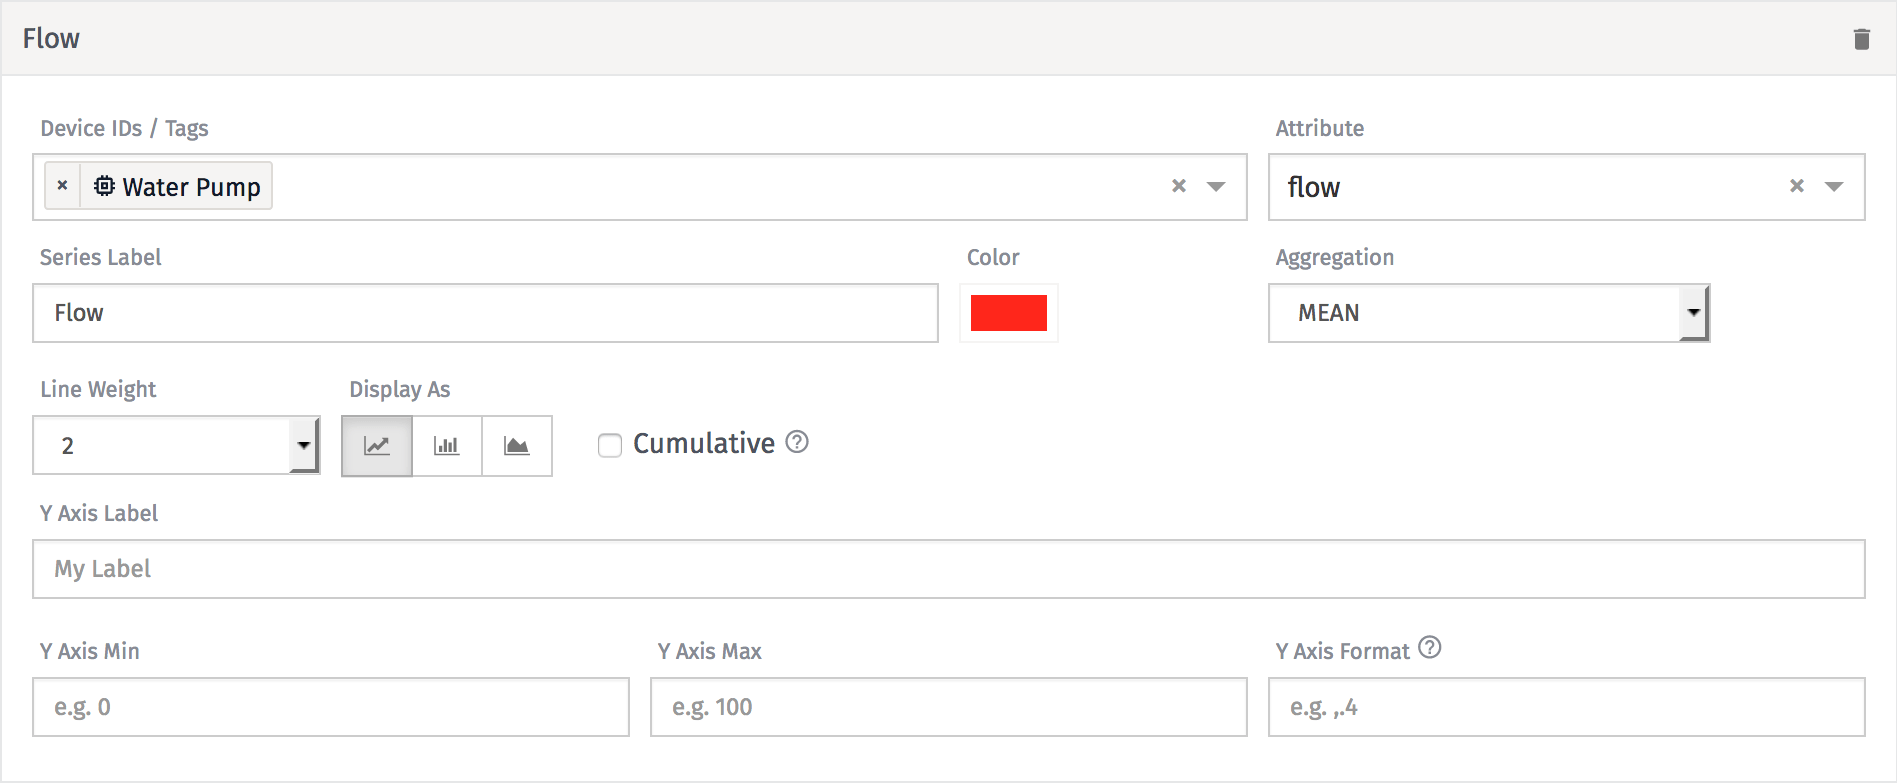
- Choose the “Water Pump” device.
- Select an attribute. In the screenshot above, I chose flow.
- Set the “Series Label” to “Flow”.
- Set the aggregation to “Mean”.
Because we chose “Mean”, each data point on the graph will represent the average of the 30 points we talked about previously.
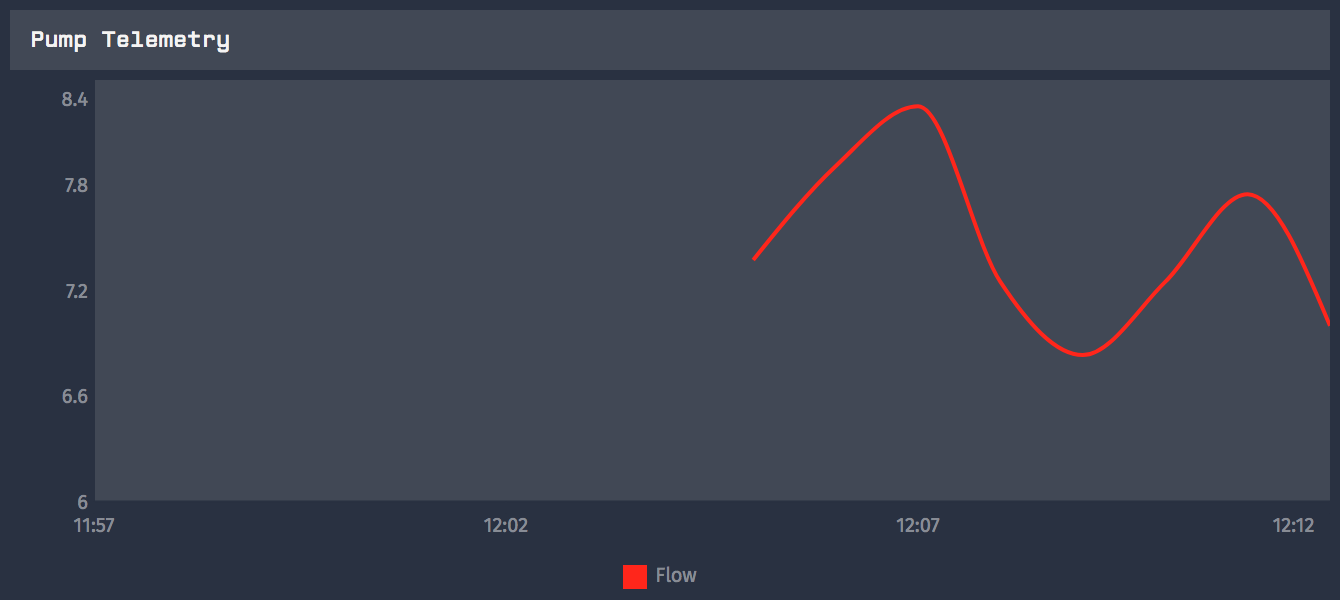
Now, we should see data appearing in the preview:
Time Series Graph Exercise:
We wanted this block to display voltage, flow and temperature. Using the “Add Segment” button, add voltage and temperature to this graph.
Once done, you should have a block that looks similar to this:
After completing the exercise, add the block to the dashboard.
Next, let’s add a Gauge Block to display the RPM of the water pump.
Adding a Gauge Block
On the “Add Block” page, click the Gauge Block:
First, we must give our block a name and choose our application.
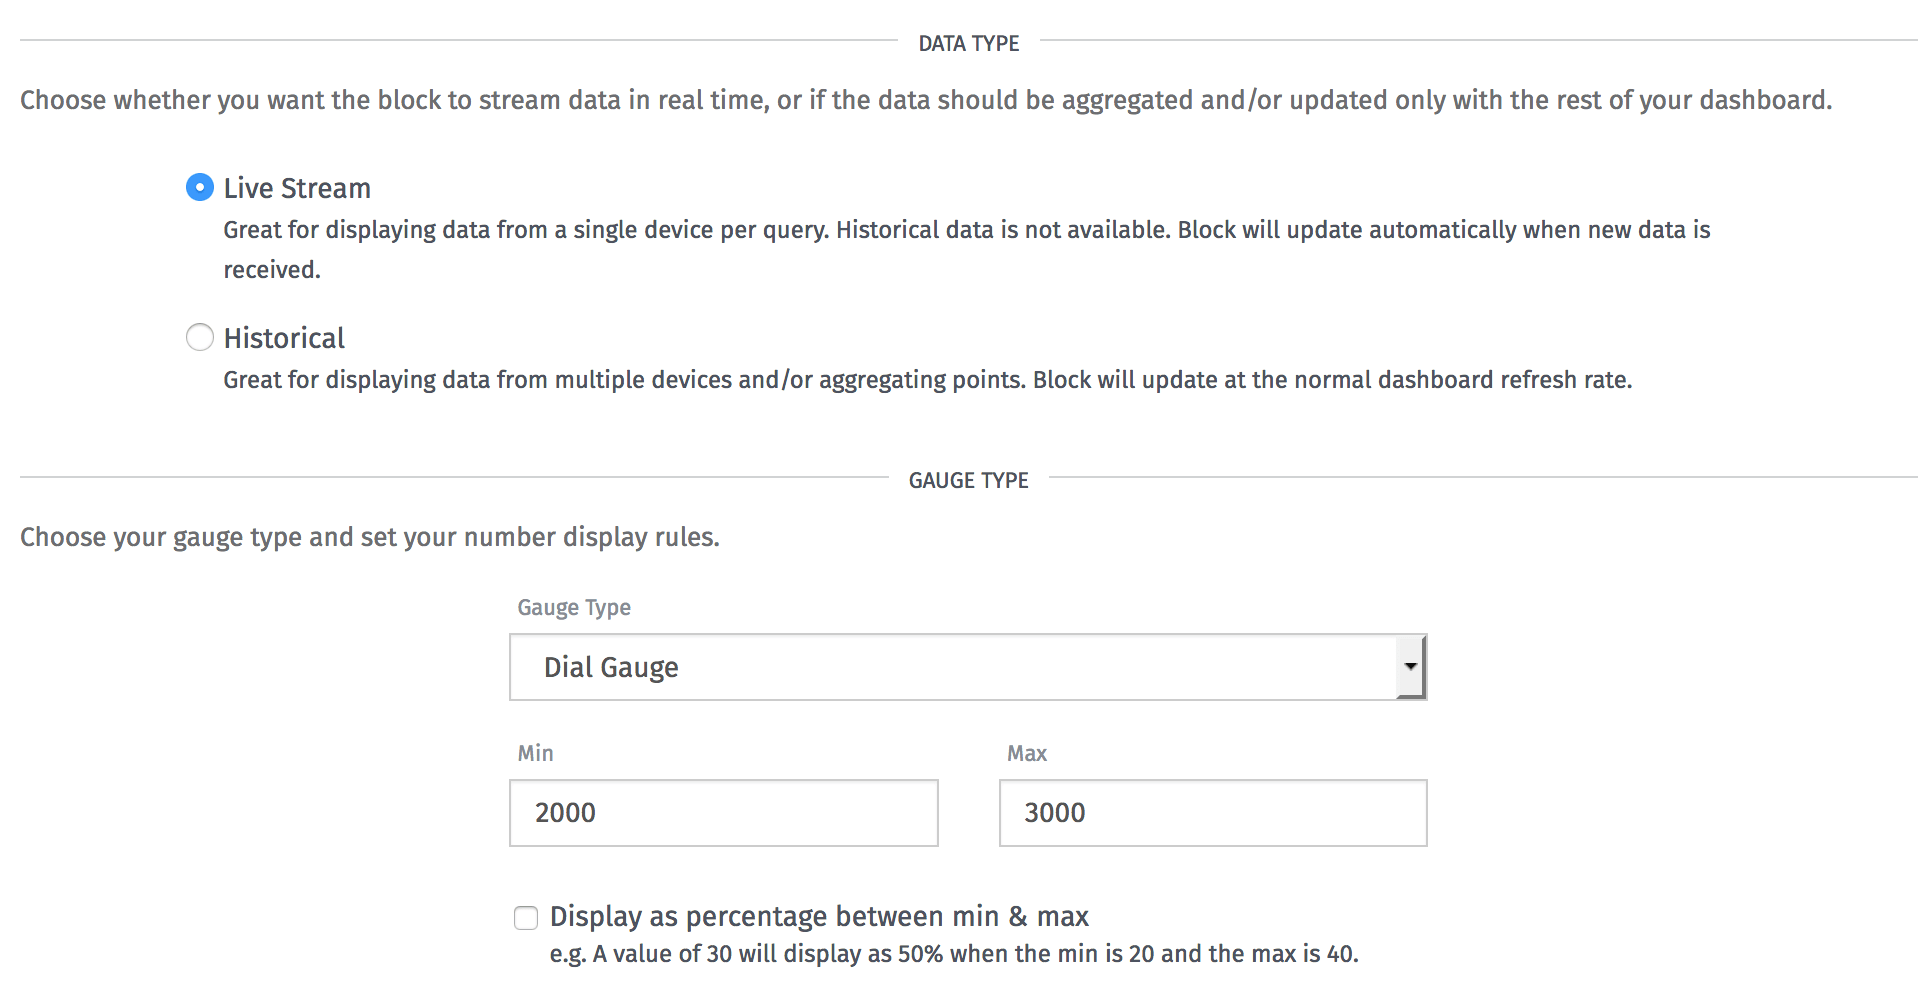
Since we are concerned with its current value within a range, this is a perfect use case for the “Live Stream” type. With this type, the block on the dashboard will just reflect a live stream of data coming in.
For our Gauge type, let’s choose a Dial Gauge, a min of 2000, and a max of 3000. These numbers are the same min and max we chose in the simulator.
Now, on to our block data:
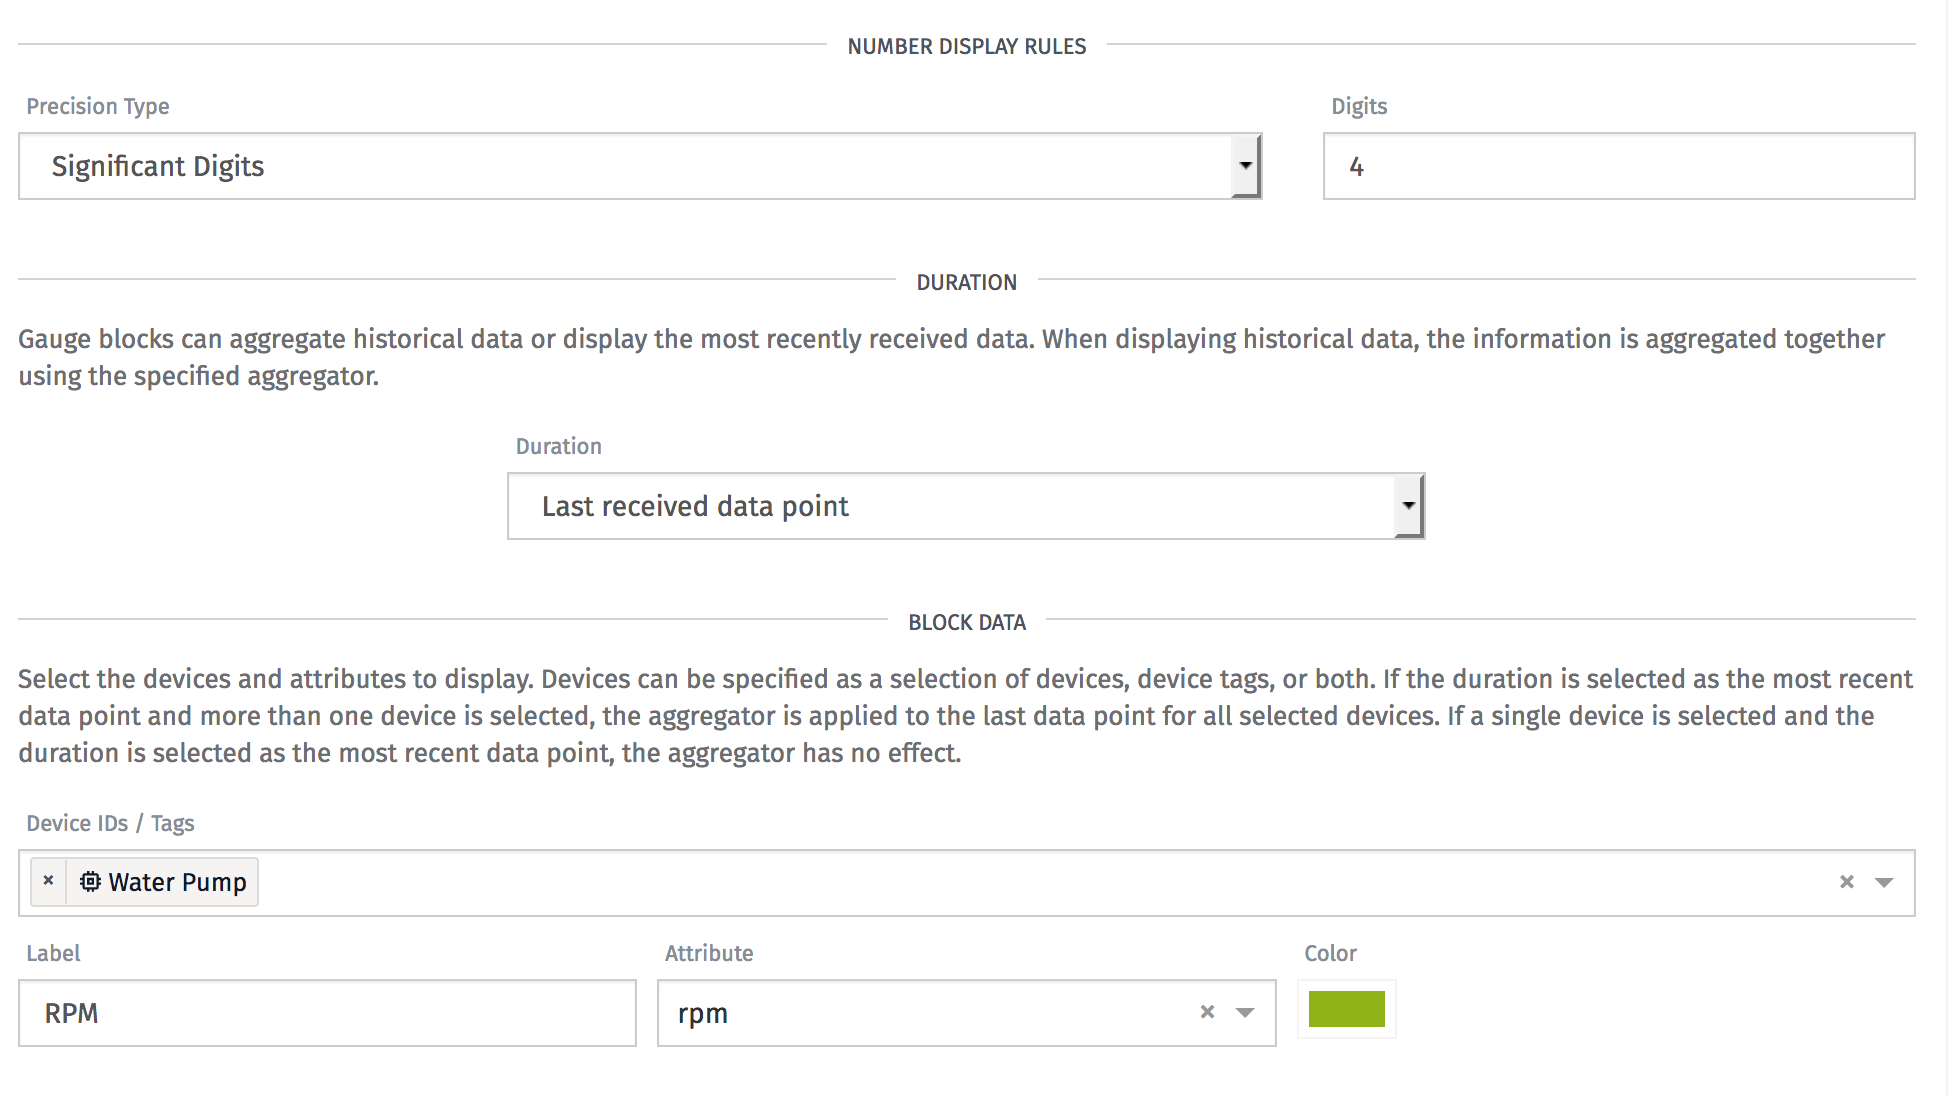
- Choose “Water Pump” as your device.
- Set “Label” to “RPM”.
- Choose the “rpm” attribute.
Once done, our preview should appear:
Gauge Block Exercise:
The Gauge block can change colors based on its current represented value. Let’s say, for our water pump, the rpm should never reach above 2500 RPM. If it does, our dashboard should reflect that, like so:

Using the "Conditional Colors", create a condition to implement this functionality into the block. Once done, if the RPM goes above 2500, you should see a block that looks like the screenshot above.
After completing the exercise, add the block to the dashboard.
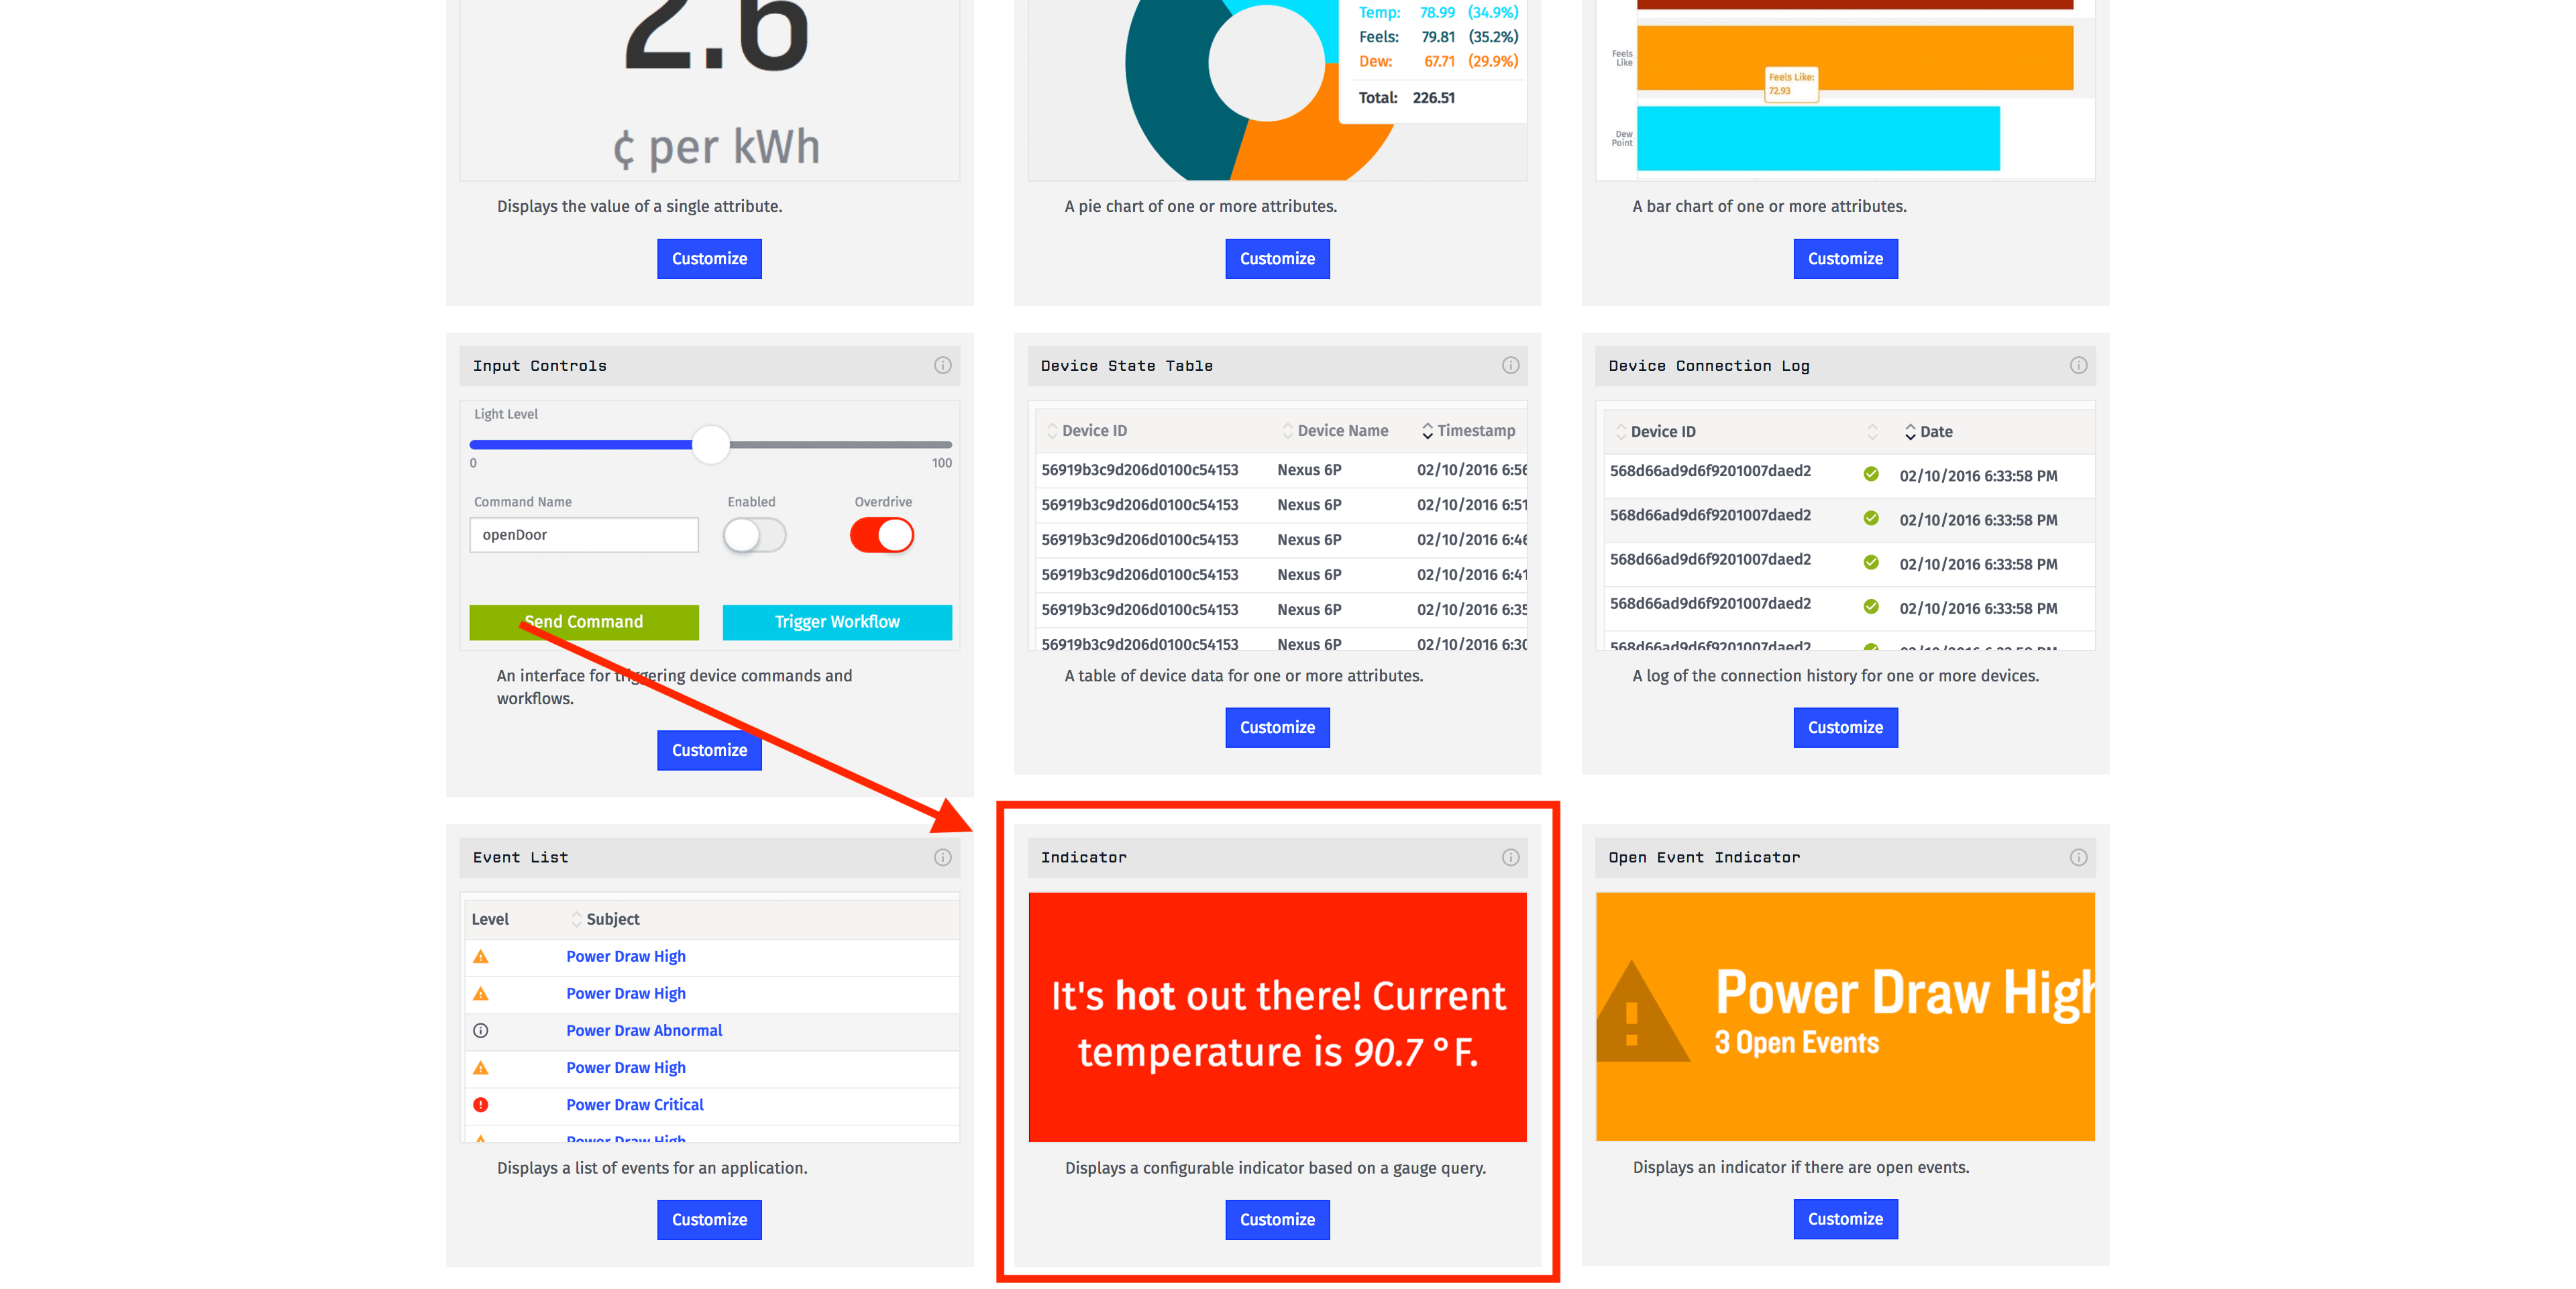
Next, we can add an Indicator Block to reflect our valve status.
Adding an Indicator Block
On the “Add Block” page, click the Indicator Block:
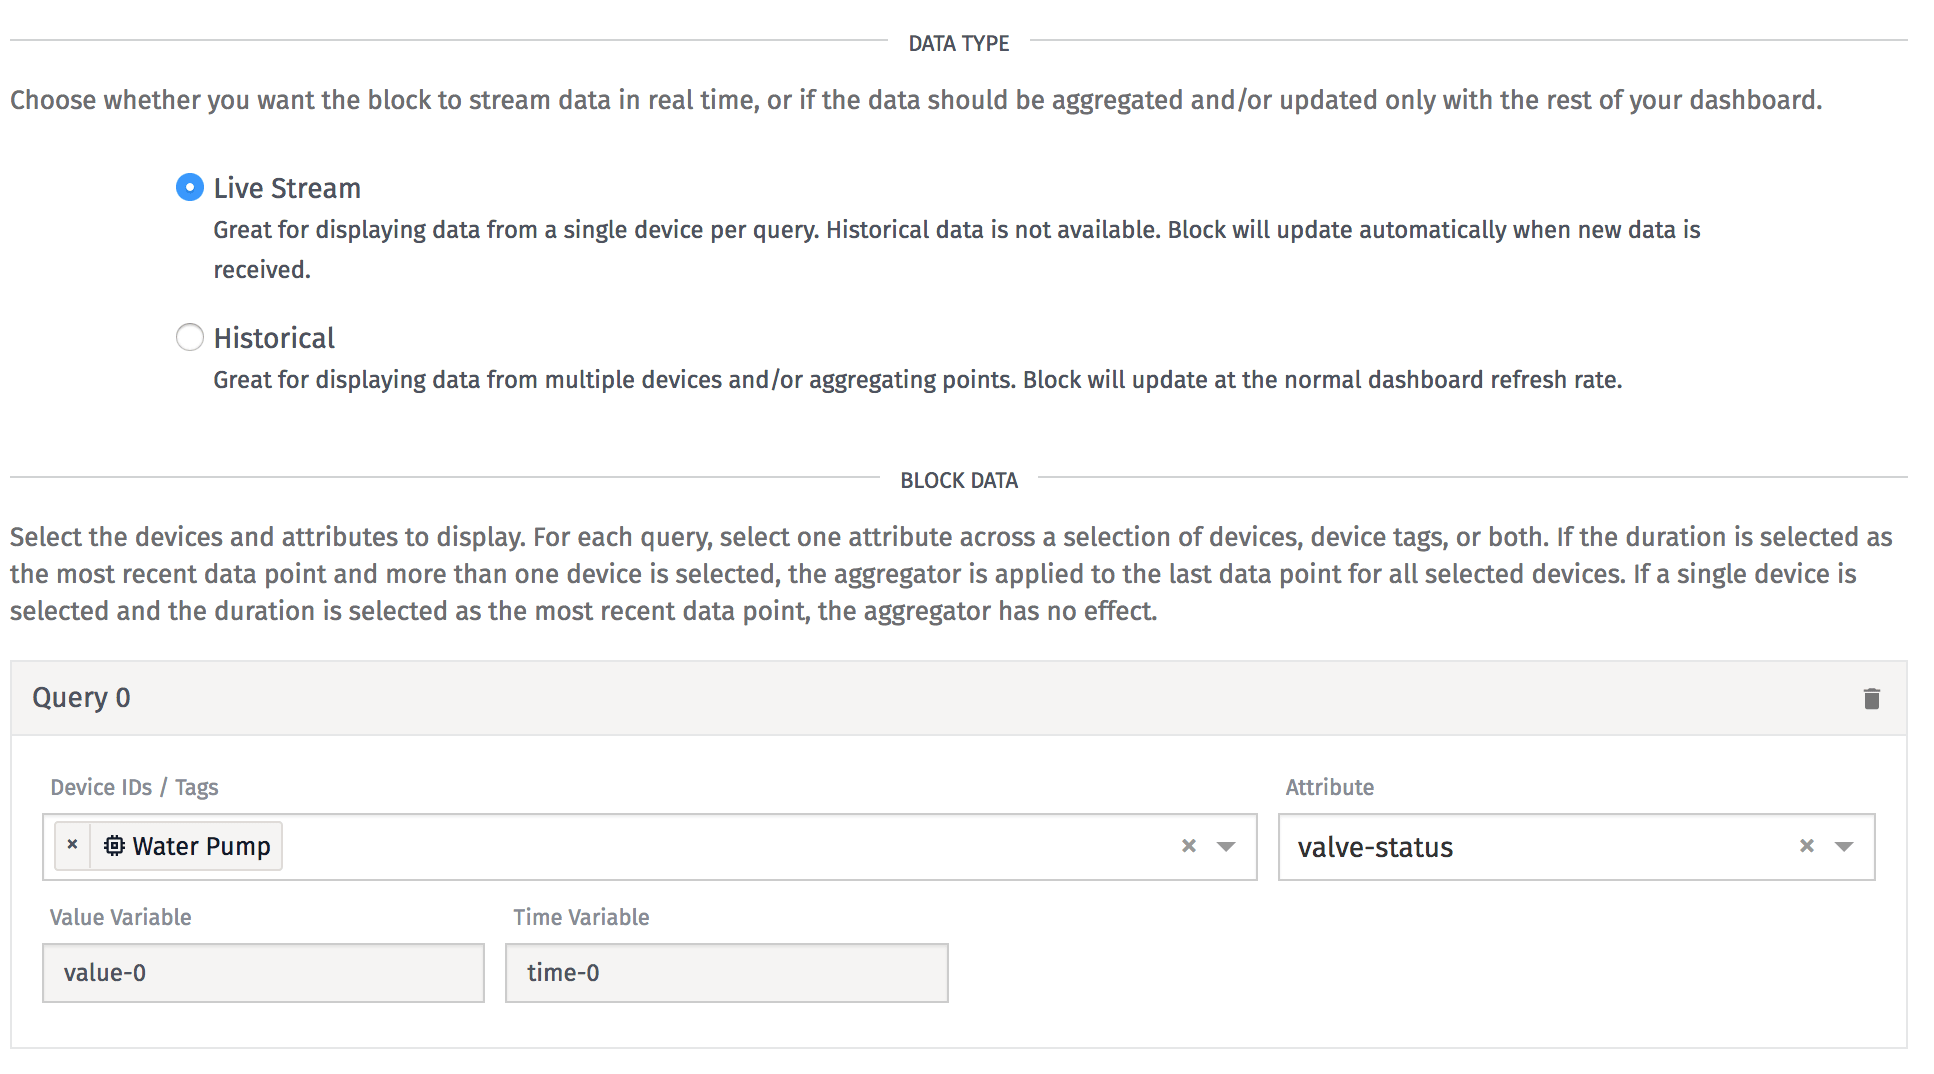
Here, we want to make the data type of this block a “Live Stream”. This will ensure that our dashboard always displays the most recent status of the valve.
We also need to define the block data:
- Choose “Water Pump” as your device.
- Choose the “valve-status” attribute.
As you may recall from the video, this will create two variables for us to use later: value-0 and time-0.
If the valve is open, we want to display a green background color and the text “open”. In order to do this, we need to check to see if the valve status is set to true. We can use a conditional to check this.
In the conditional, we can check for {{ value-0 }} == true (is the status of the value true, or open). If it is, it will display the label and color we define here:

Once done, in the preview to the right, when the valve is reporting as open, we can see this:

Indicator Block Exercise:
If the valve is closed, let’s do the exact opposite. Create the conditional to cause the Indicator Block to be red and display “closed” when the status is false.
After completing the exercise, add the block to the dashboard.
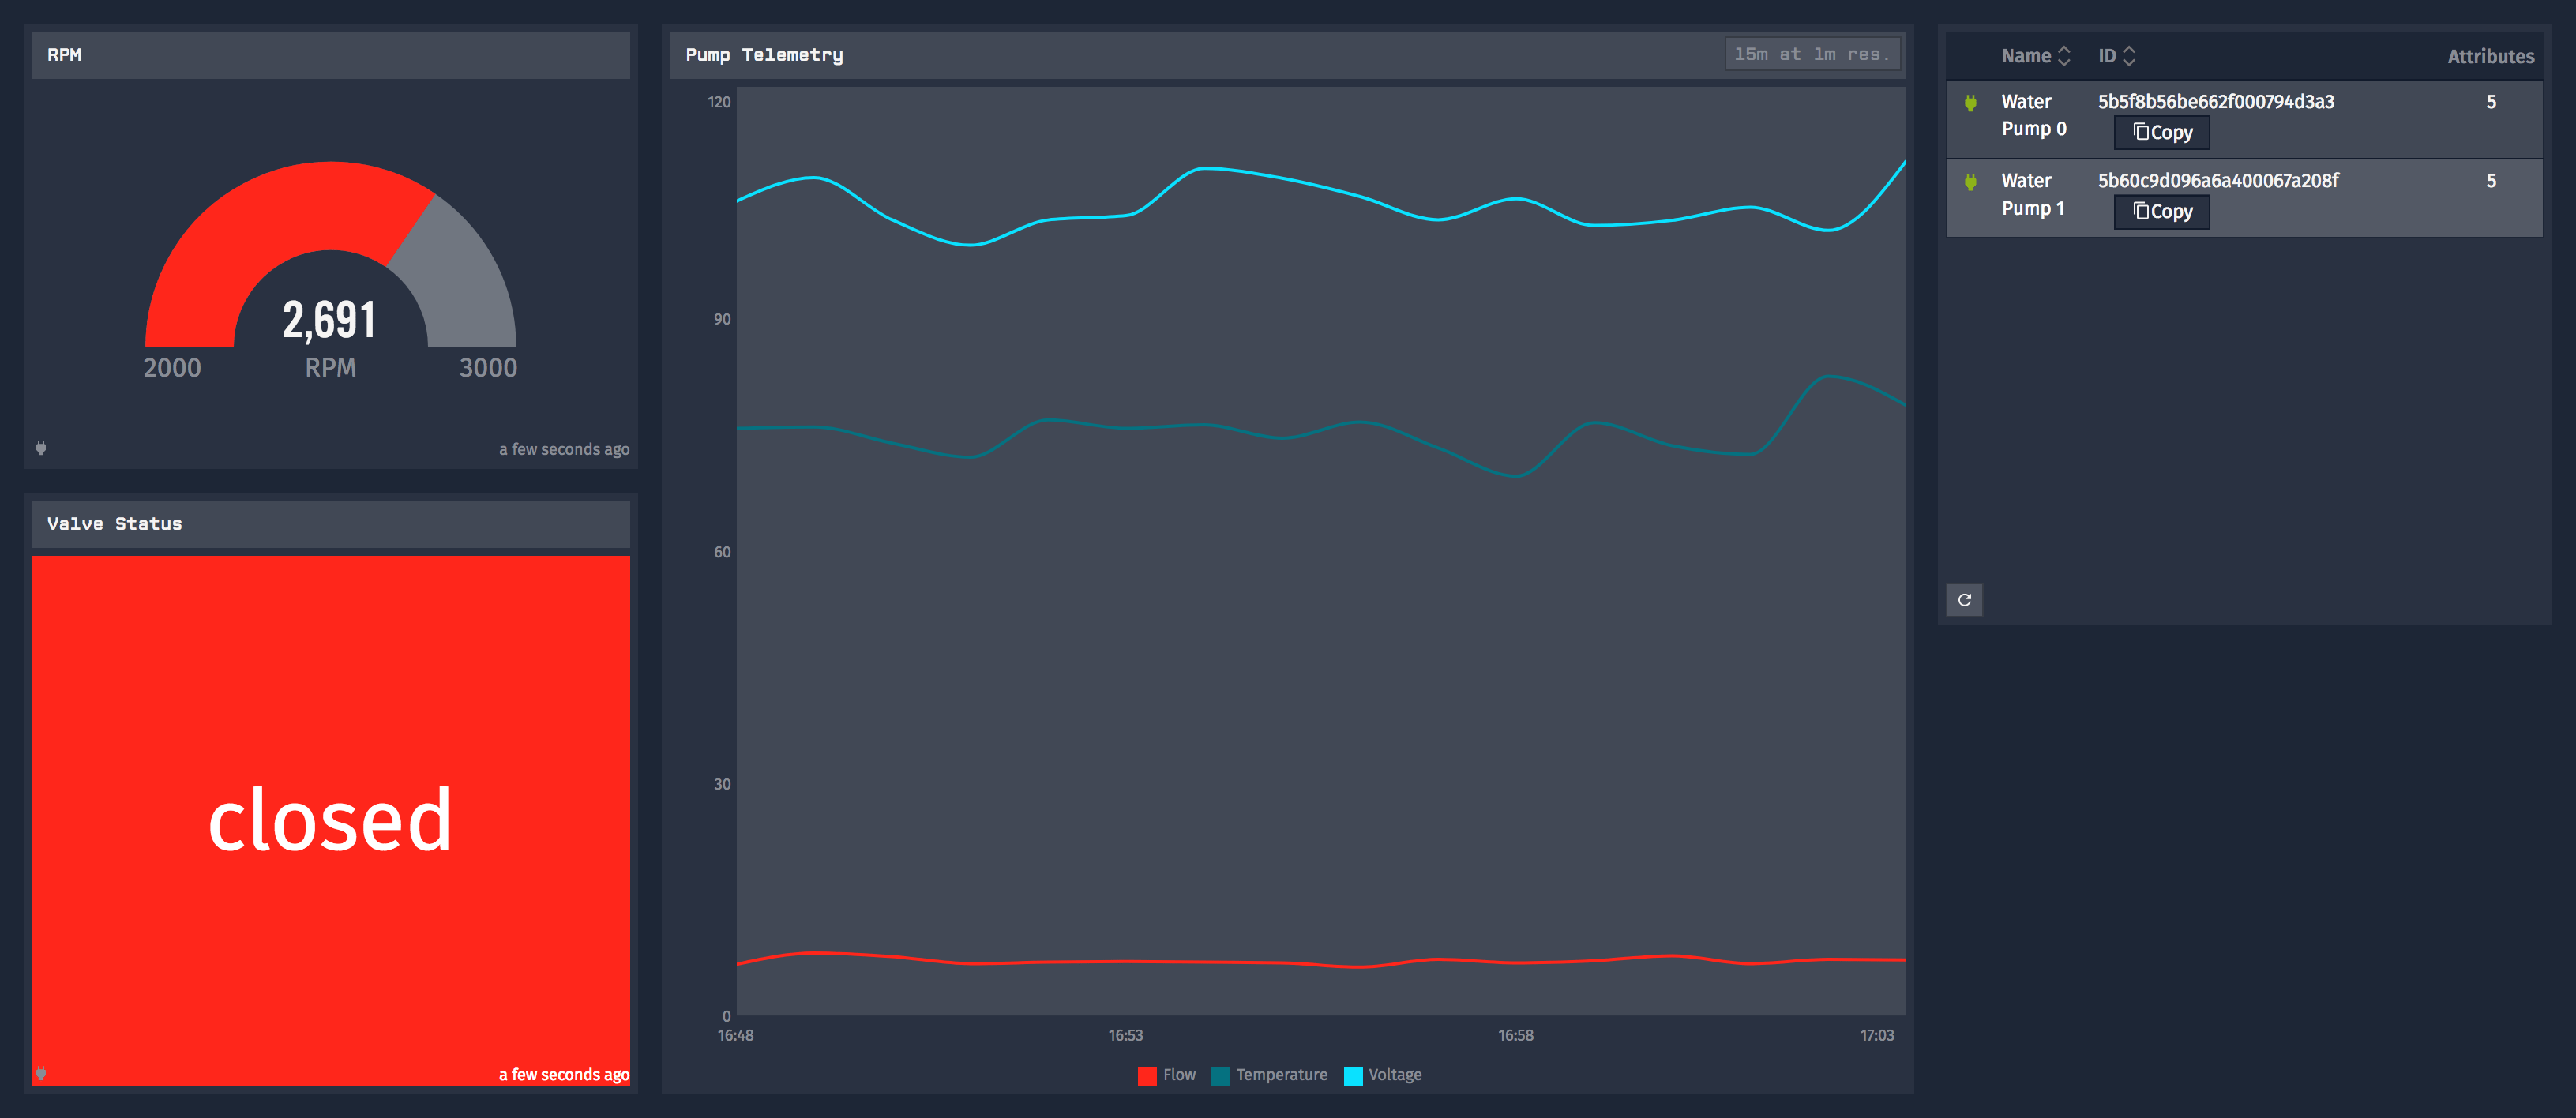
Complete
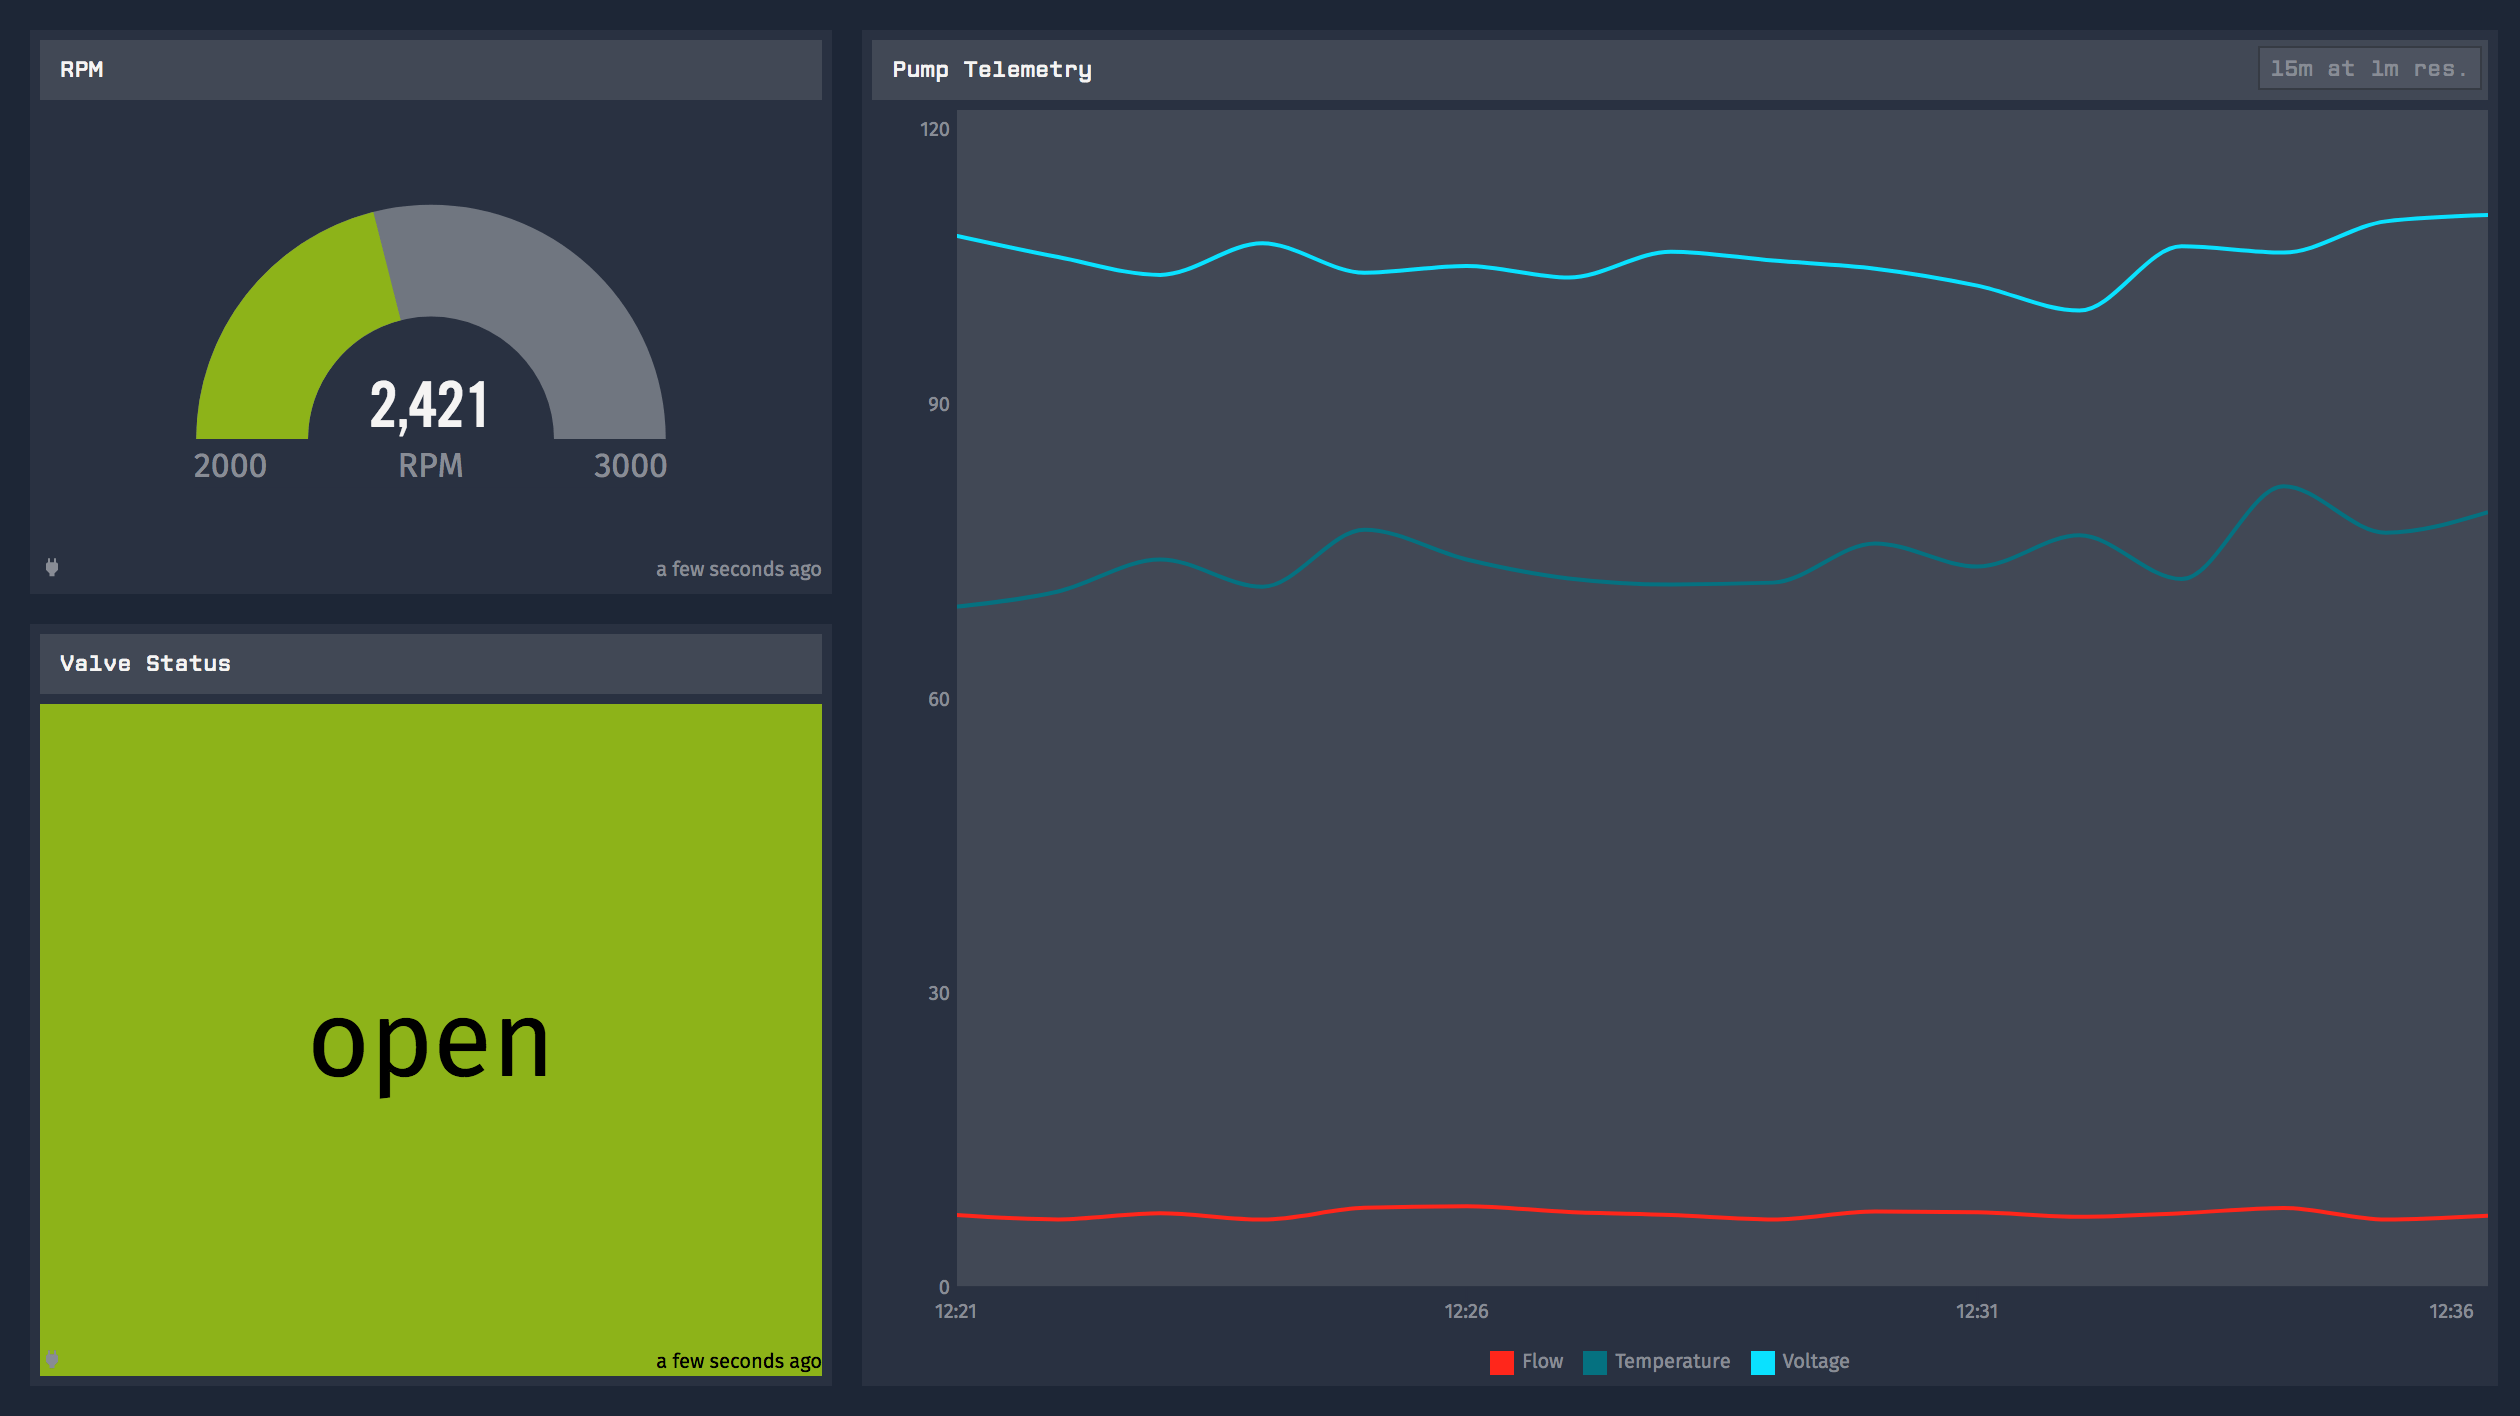
Now, our dashboard is complete! If all went well, we should have something that looks like this:
Part Two: Context Variables
Currently we only have one device and one dashboard. But, what if we have multiple devices? As you may recall from the videos, we don’t want to create a dashboard for each device; we can use context variables to make this dashboard reusable.
More Devices
Now, we are going to create a reusable dashboard. But first, we need a new device. If you go to your current device settings, you can clone your device.
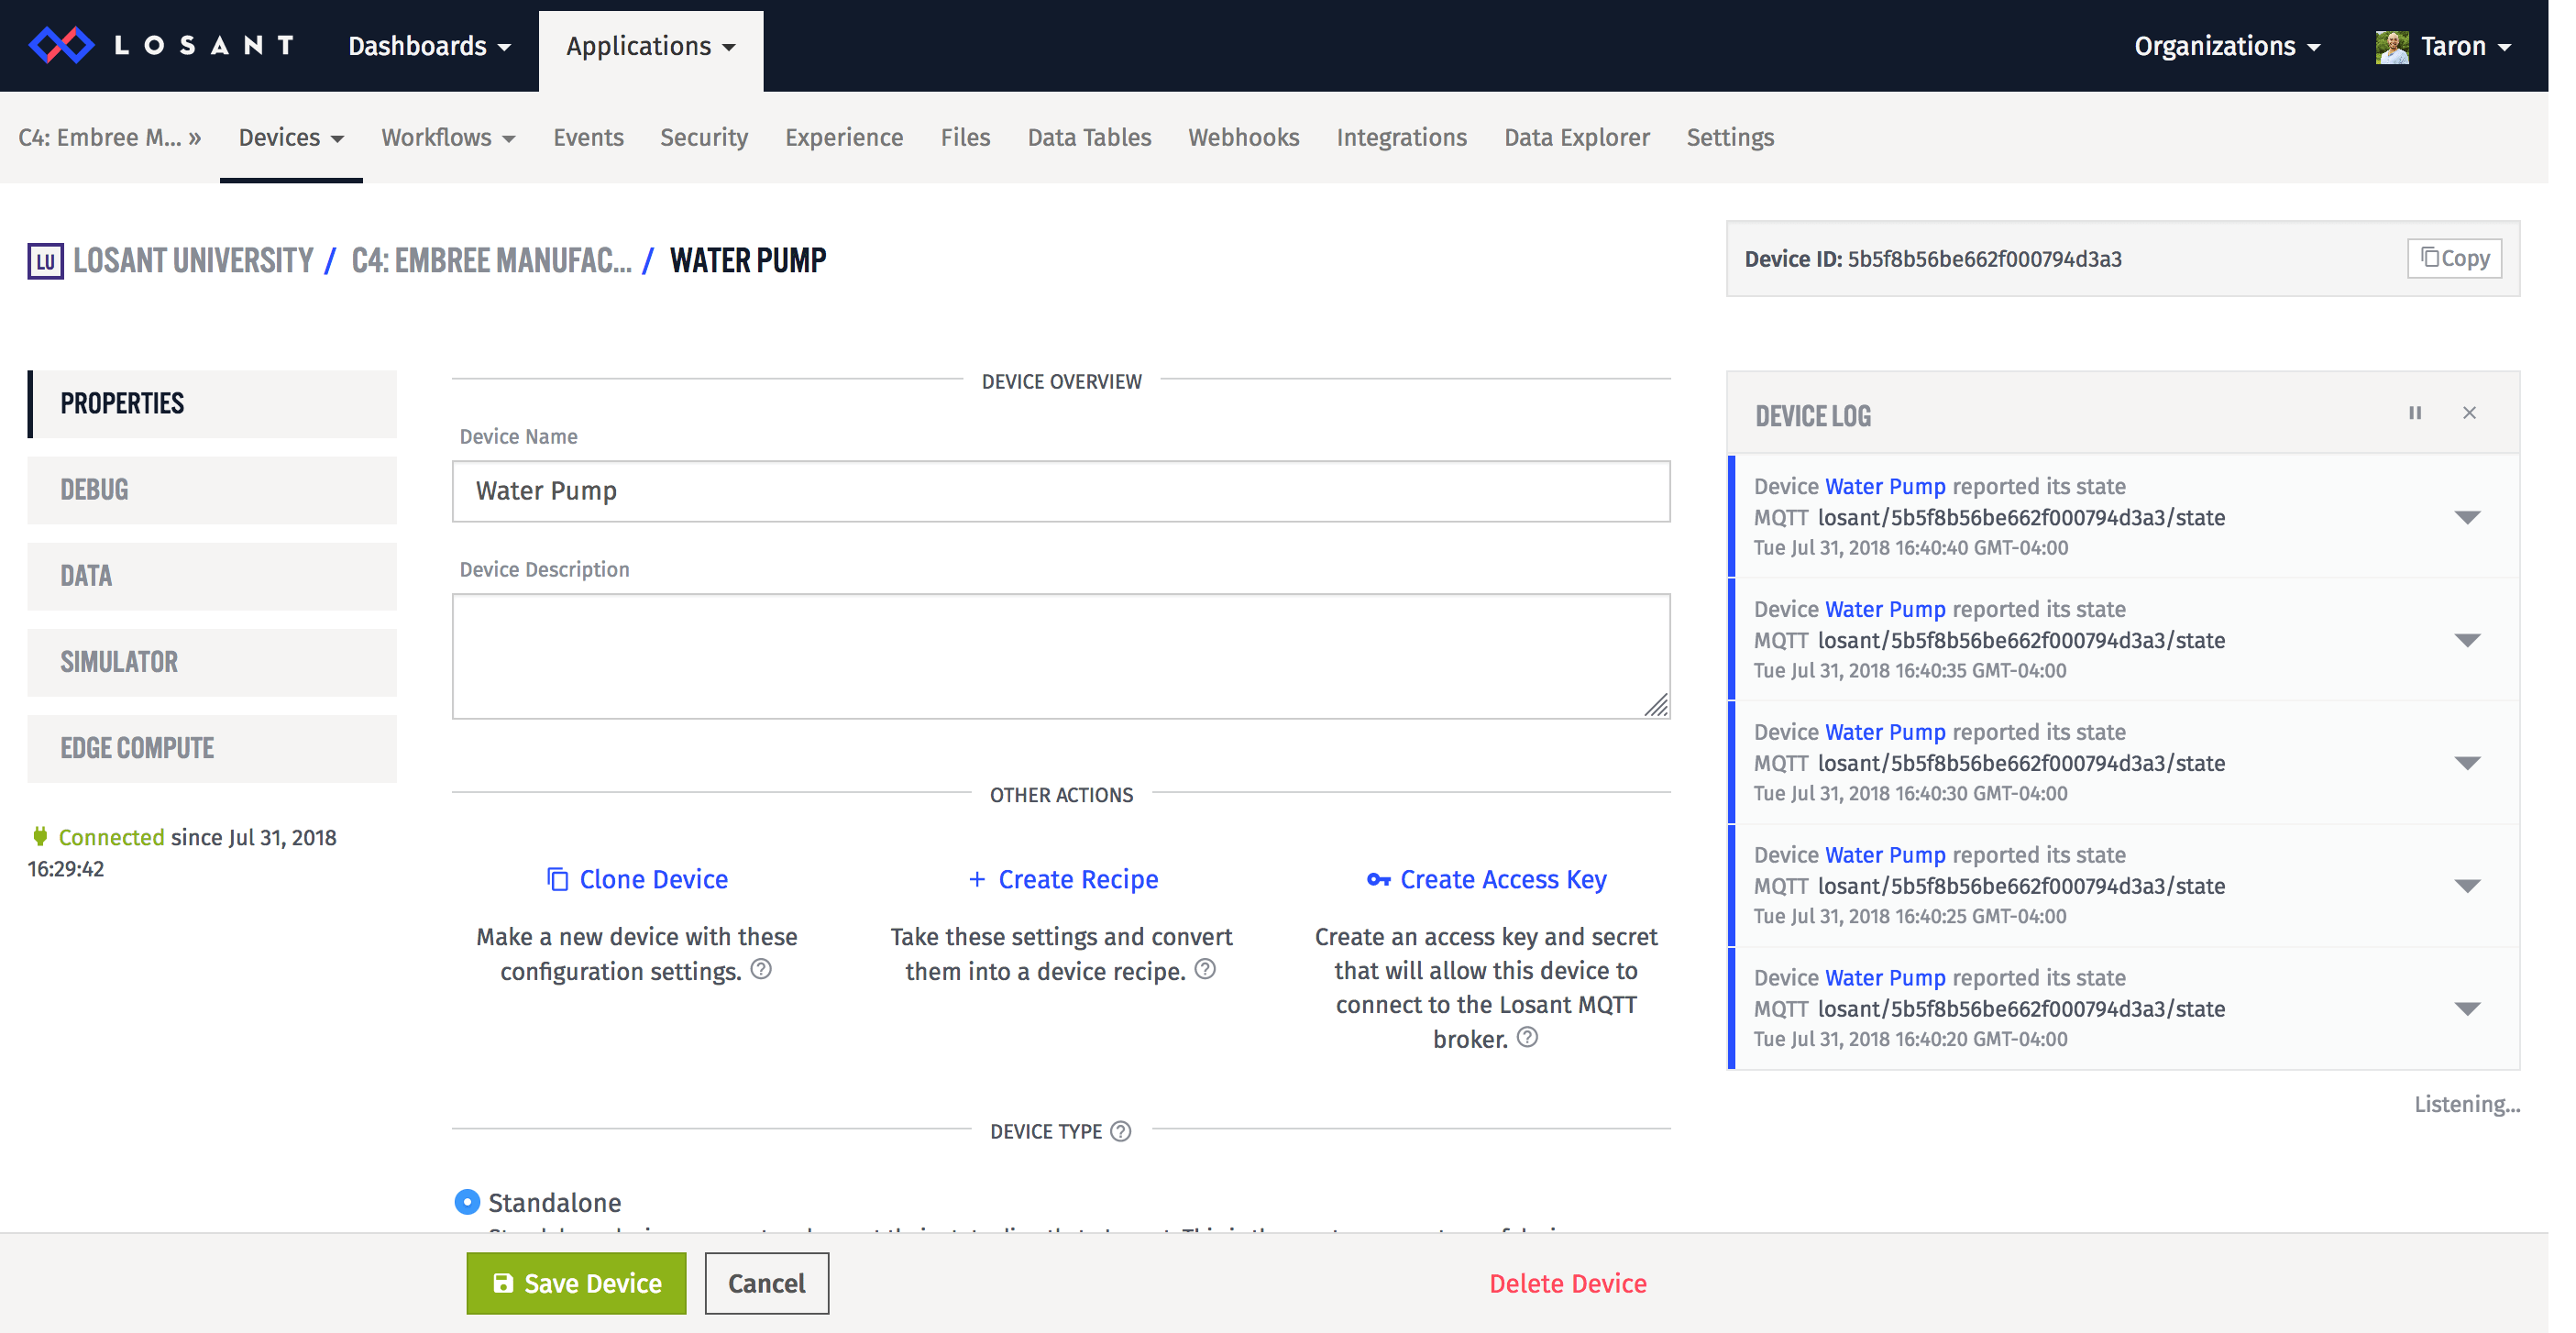
Also, to make our devices more easily identifiable, let’s rename the devices to “Water Pump 0” and “Water Pump 1”.

Before we change our dashboard, our new device needs to be reporting data to Losant. To do so, we can use the simulator.
Simulate Extra Device Exercise:
Your task is simple: simulate data for “Water Pump 1” (the newly created device).
Remember, the simulator is using your browser window as the device. So, you must leave this browser window open for your device to simulate data. This means you should have two independent tabs at this point generating data.
Next, we can add a Device List Block to the dashboard to display a list of all of our devices.
Add a Device list Block
On the “Add Block” page, choose the Device List Block:
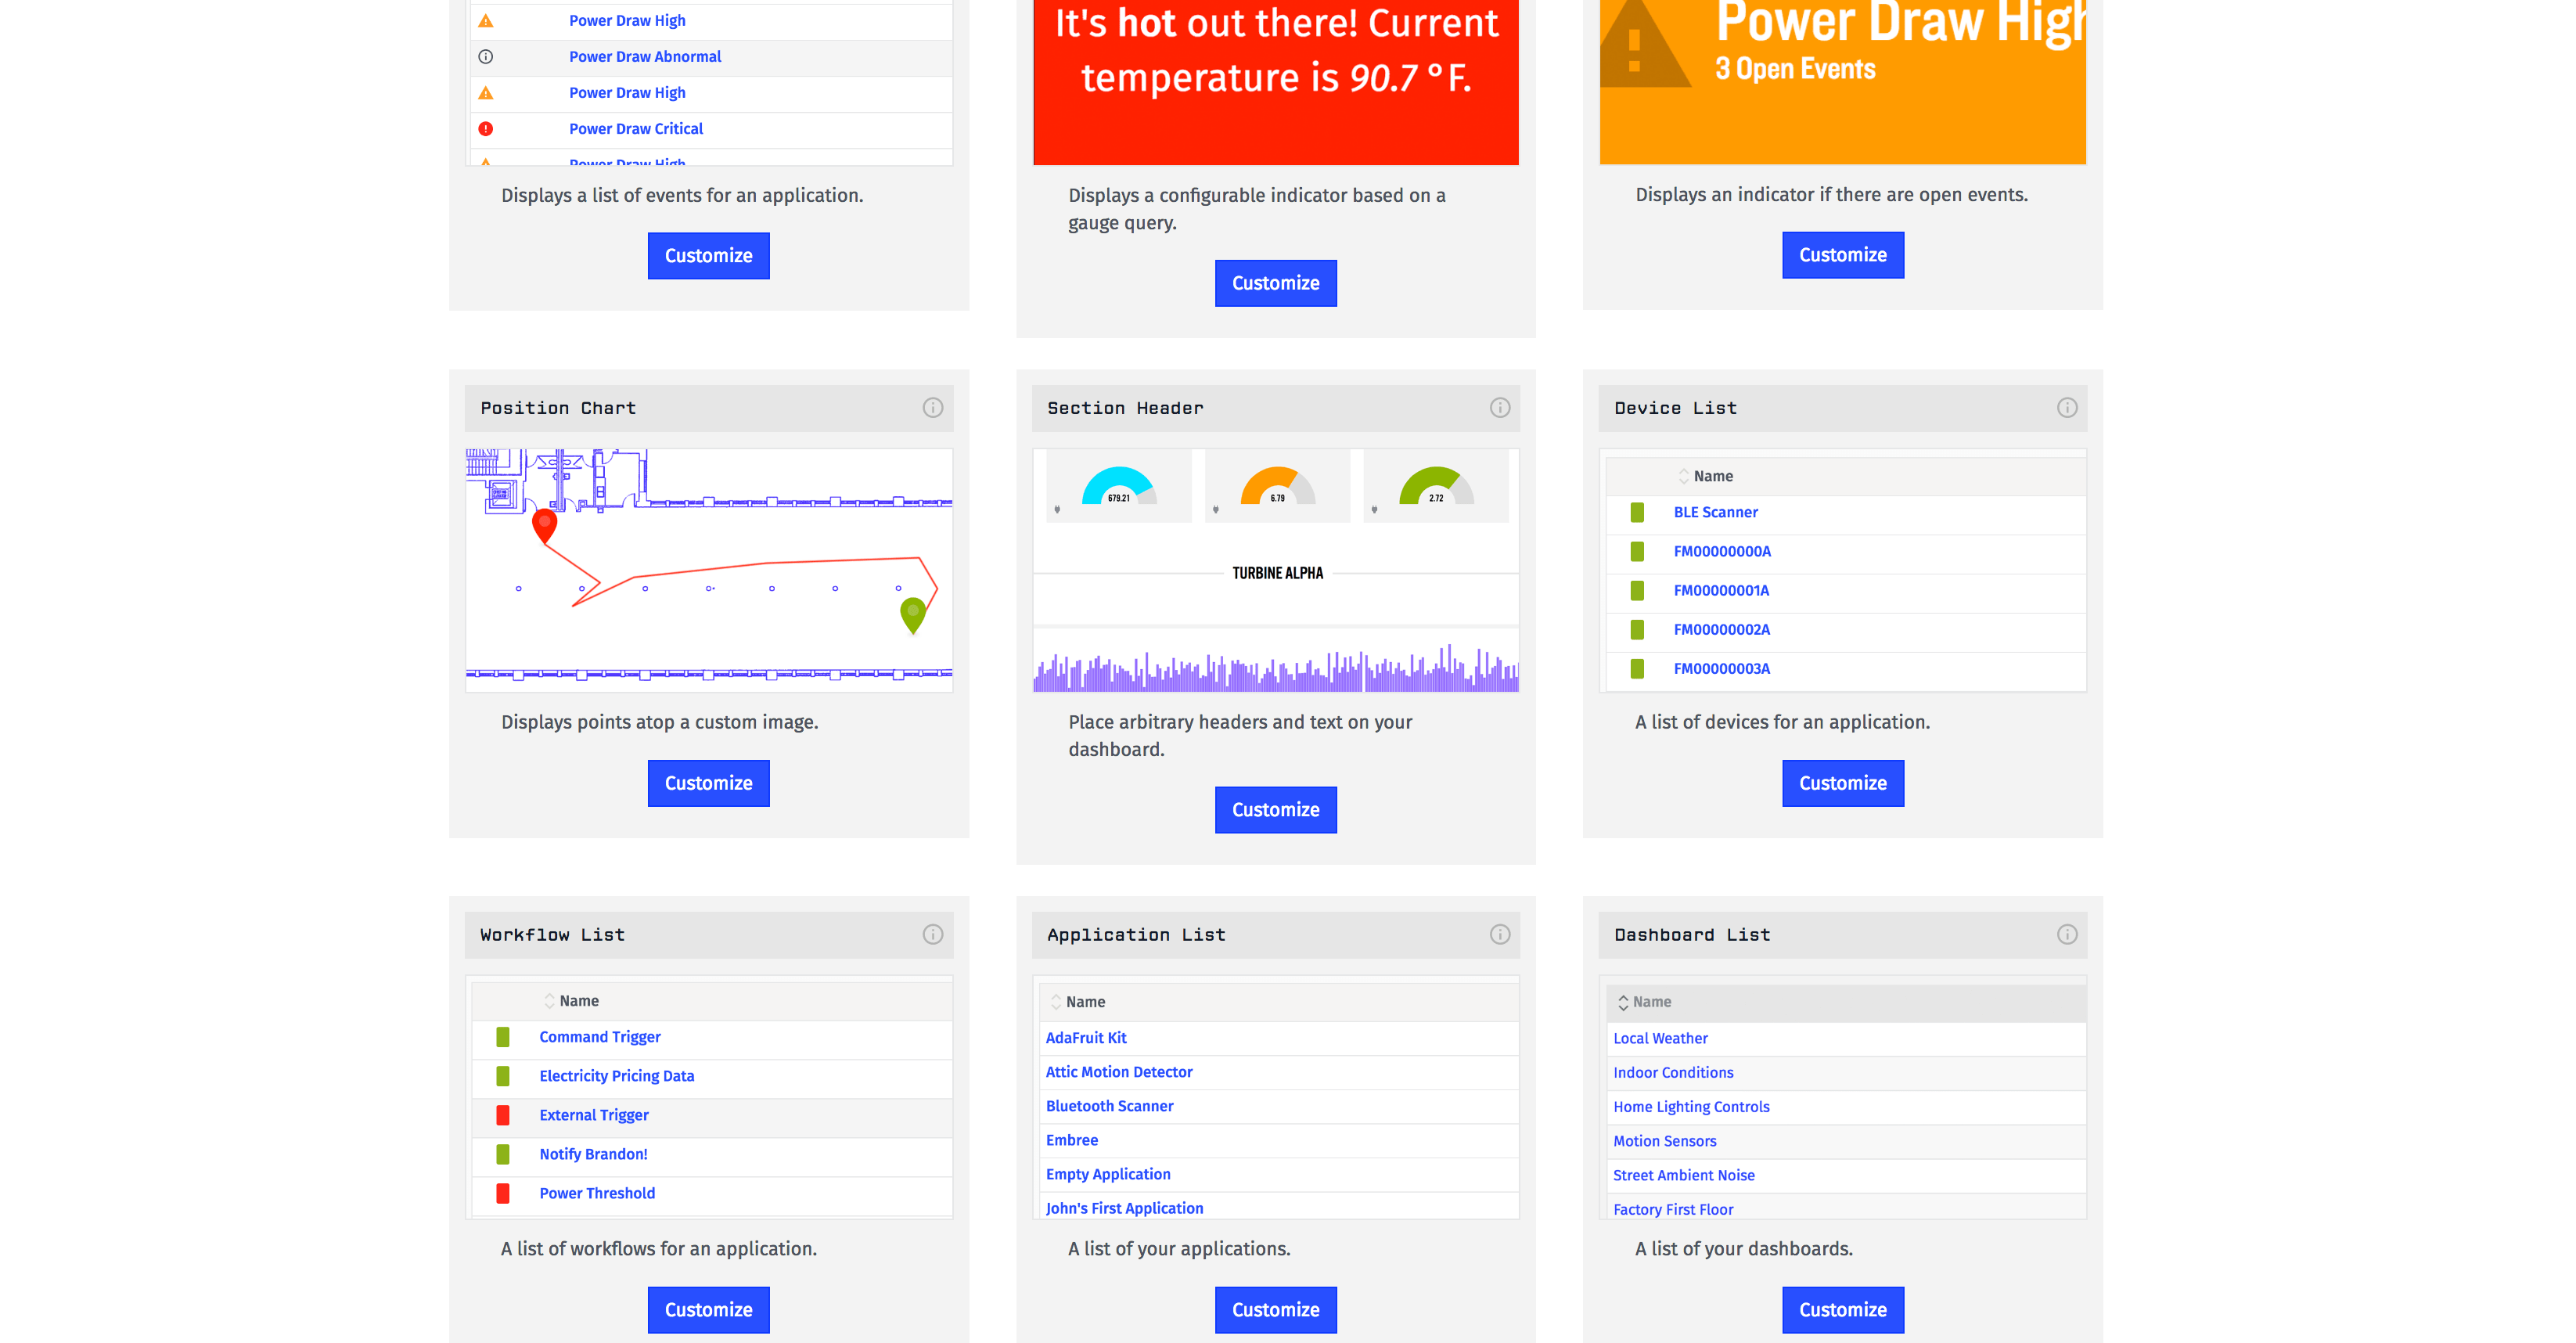
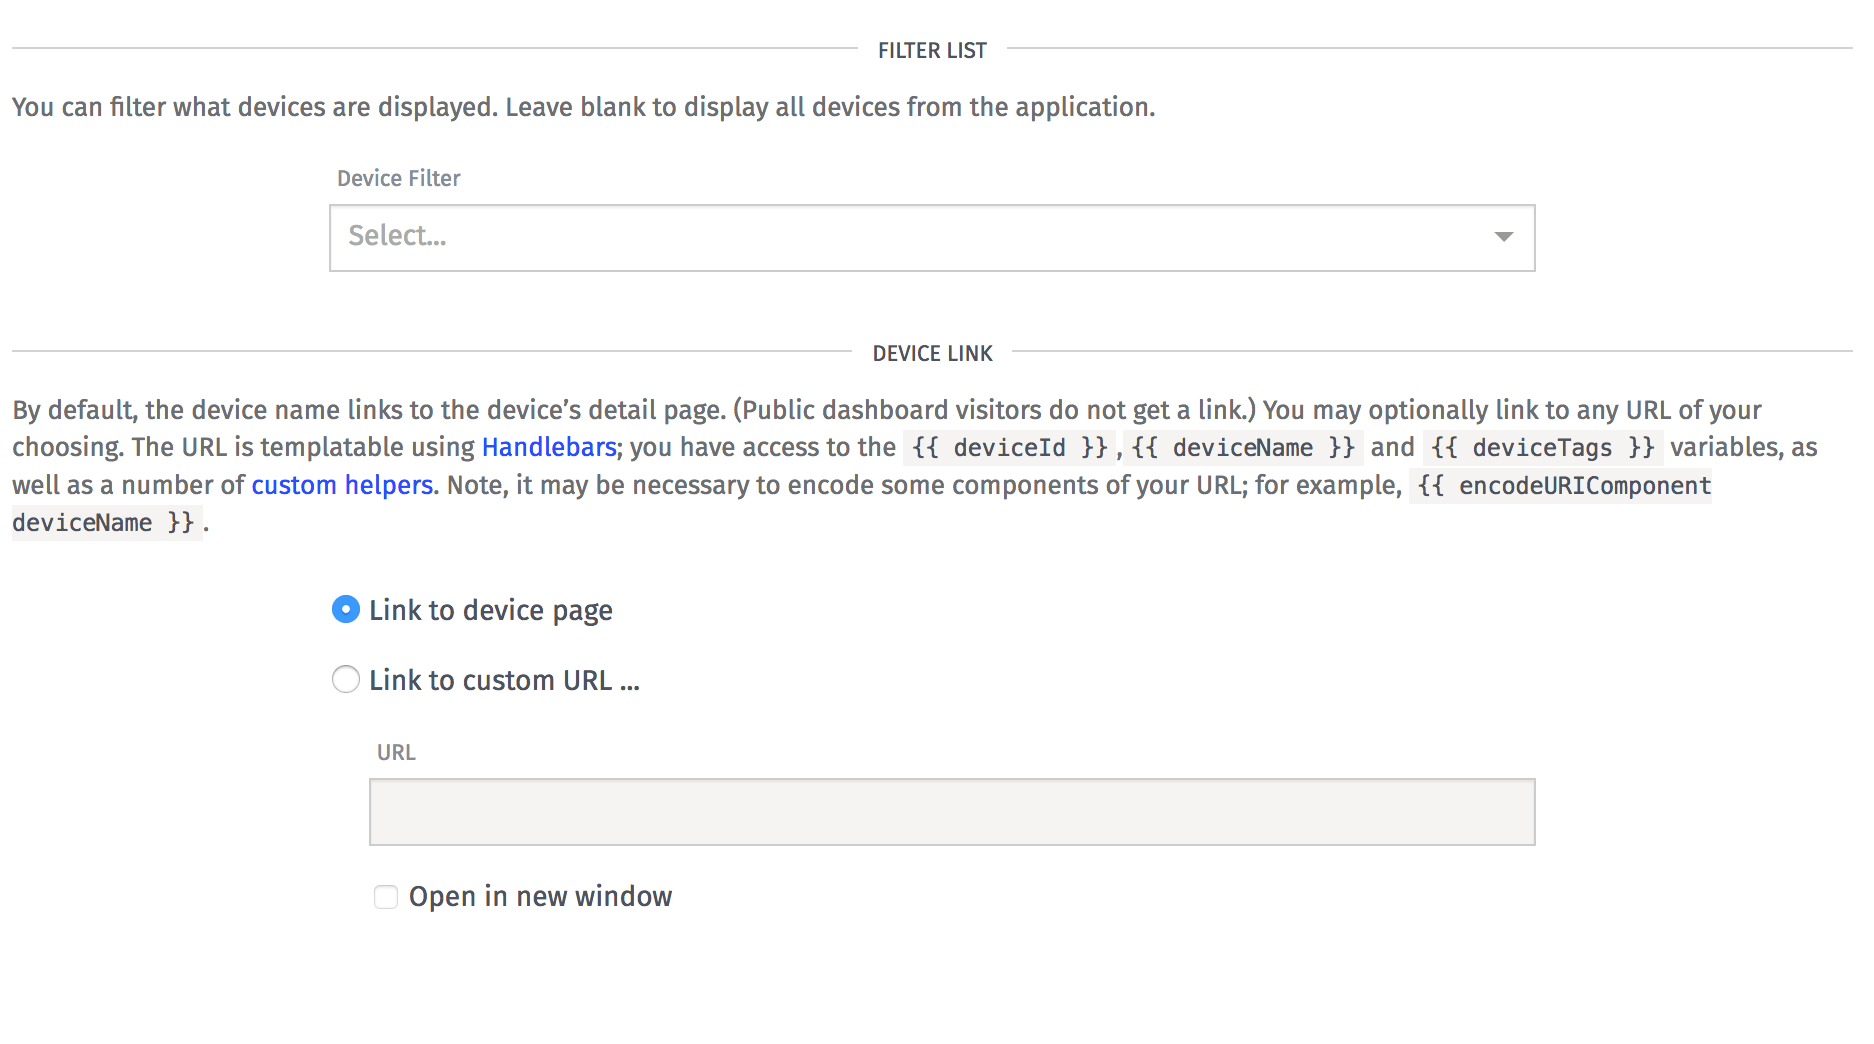
In the block settings, we can optionally choose to filter our devices, or if we don’t filter, the list will include all of our devices. Since we only have two devices, we can leave this blank.
The items in the list can be a link. We will change this later, but for now, just leave it as a link to the device page.
Here is what the preview should look like:
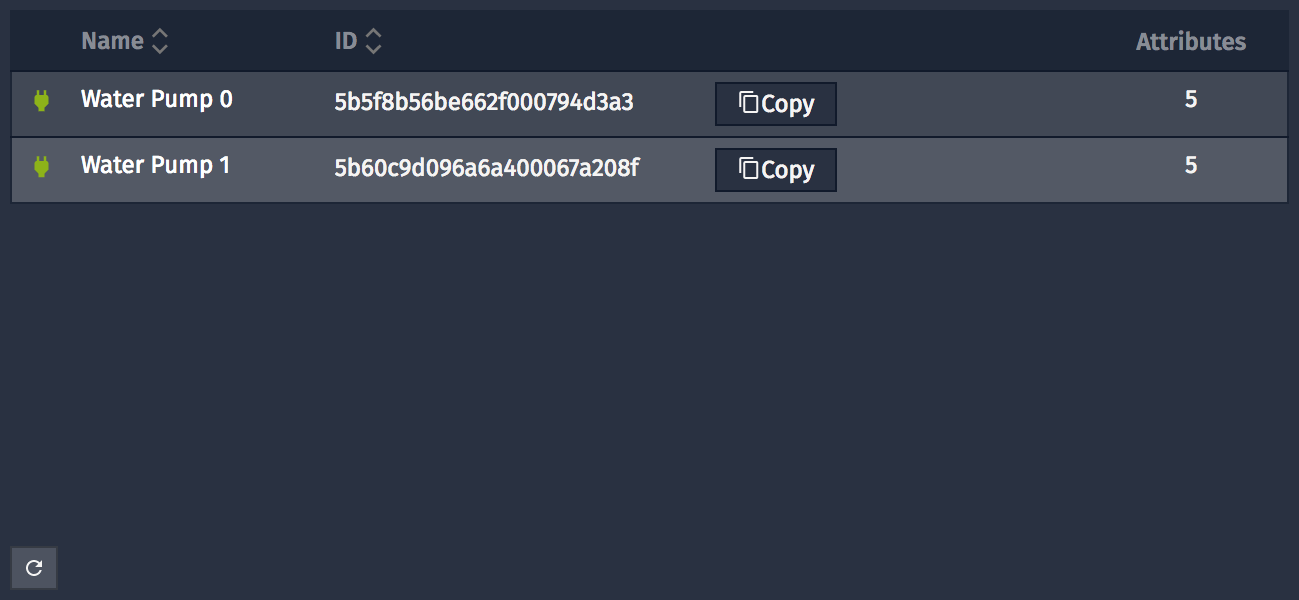
Let’s also add this block to our dashboard:
Adding Context Select “Add Context” in the dashboard settings.
Let’s create some context variables. First, let’s create a context variable for deviceId.
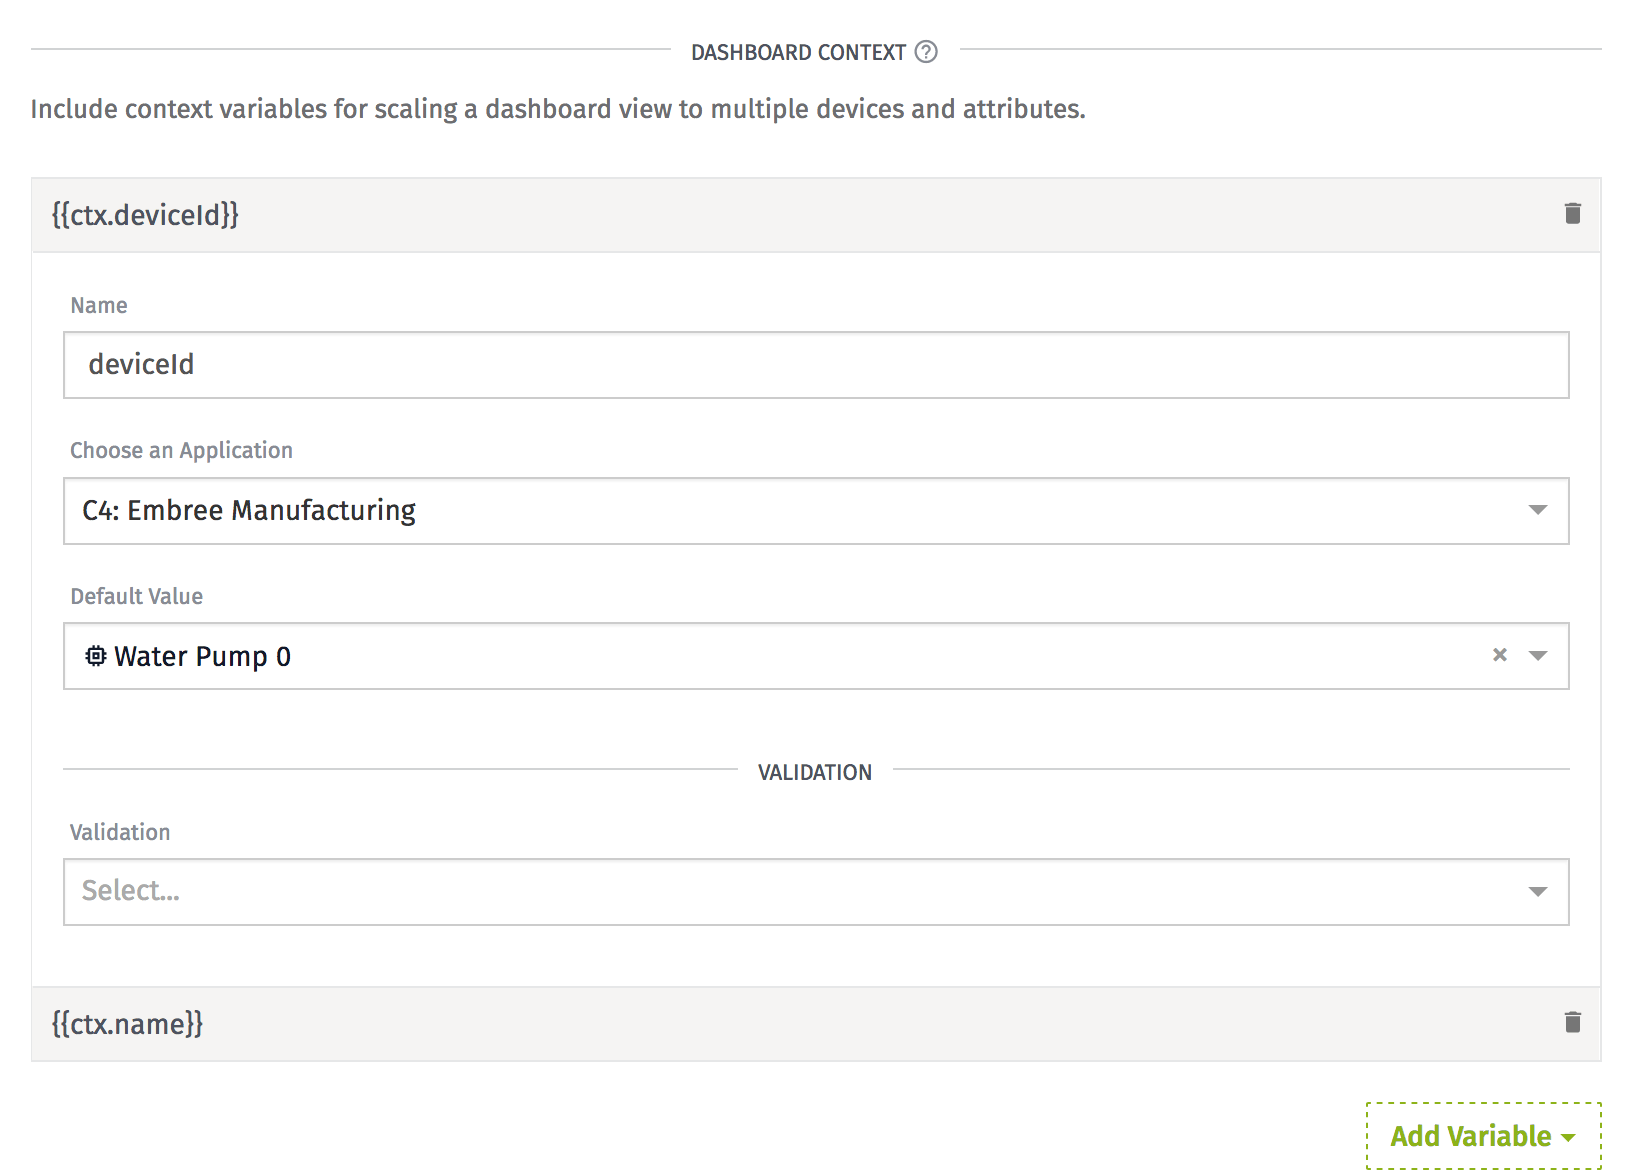
- Name the variable “deviceId”
- Choose the proper application
- Set “Water Pump 0” as the default value.
Next, create a context variable--it will be of type String--for the name of the device. This will be helpful later to see the name of the device we are currently viewing.
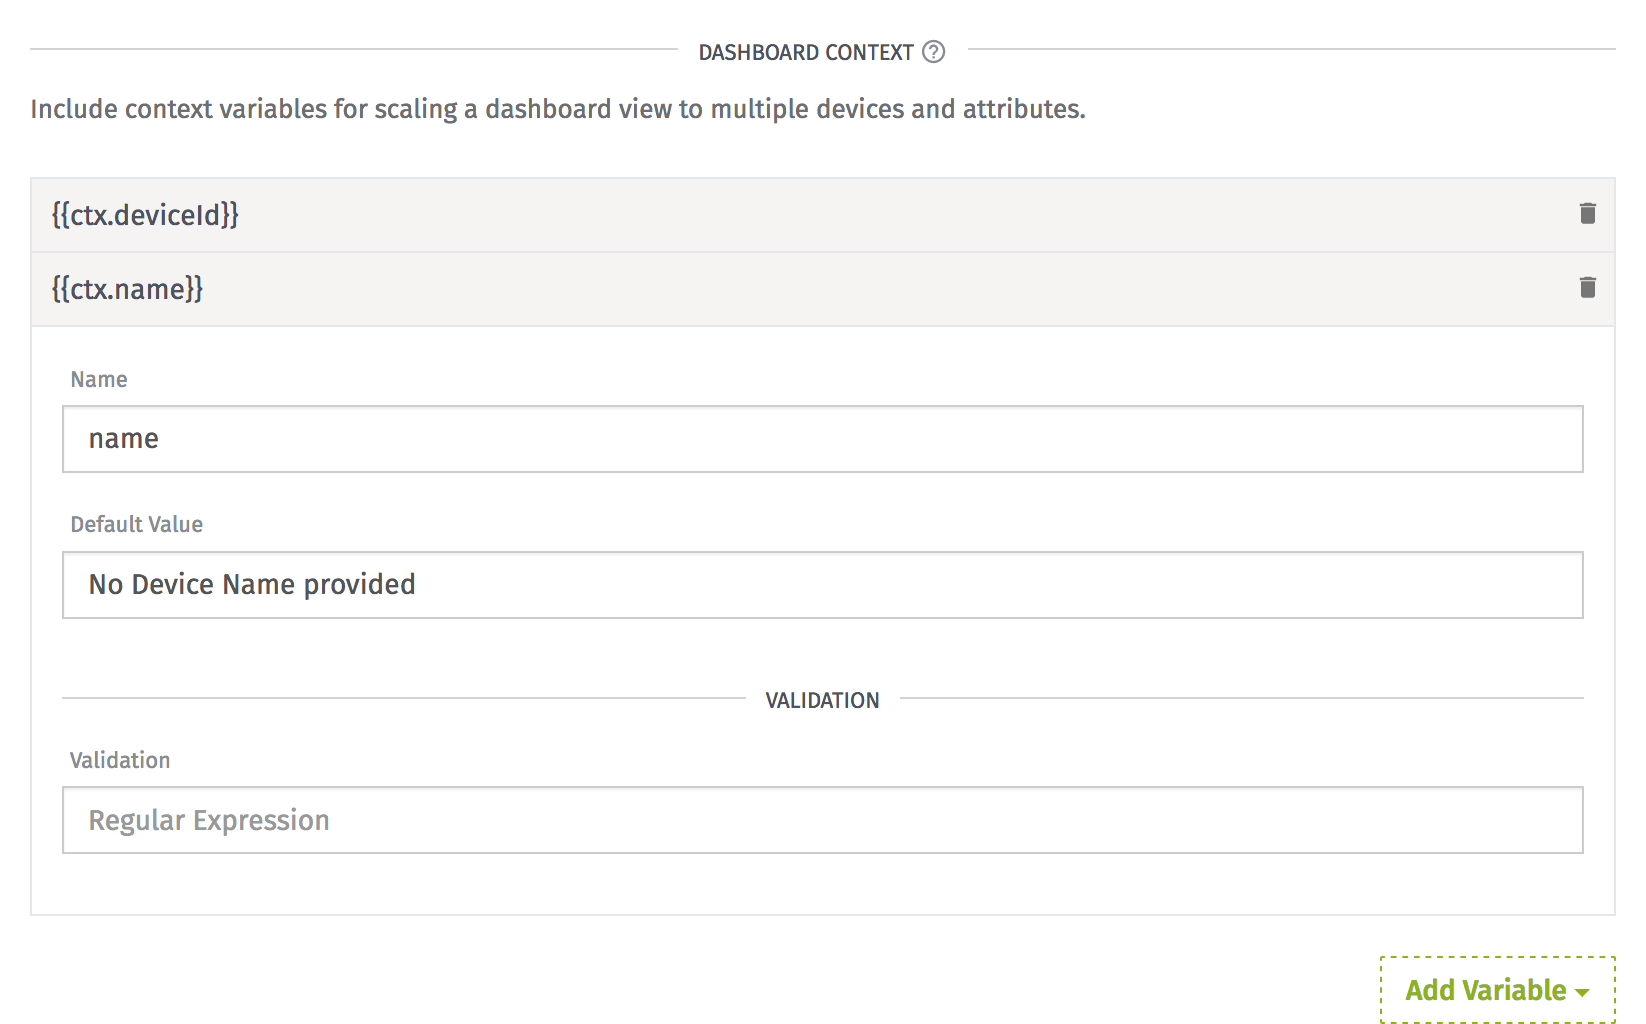
Save the variables; now let’s use them.
Update the Time Series Graph
Now that we have some context variables, let’s update the Time Series Graph to use the deviceId context variable.
Choose “Edit Settings” in the block settings:
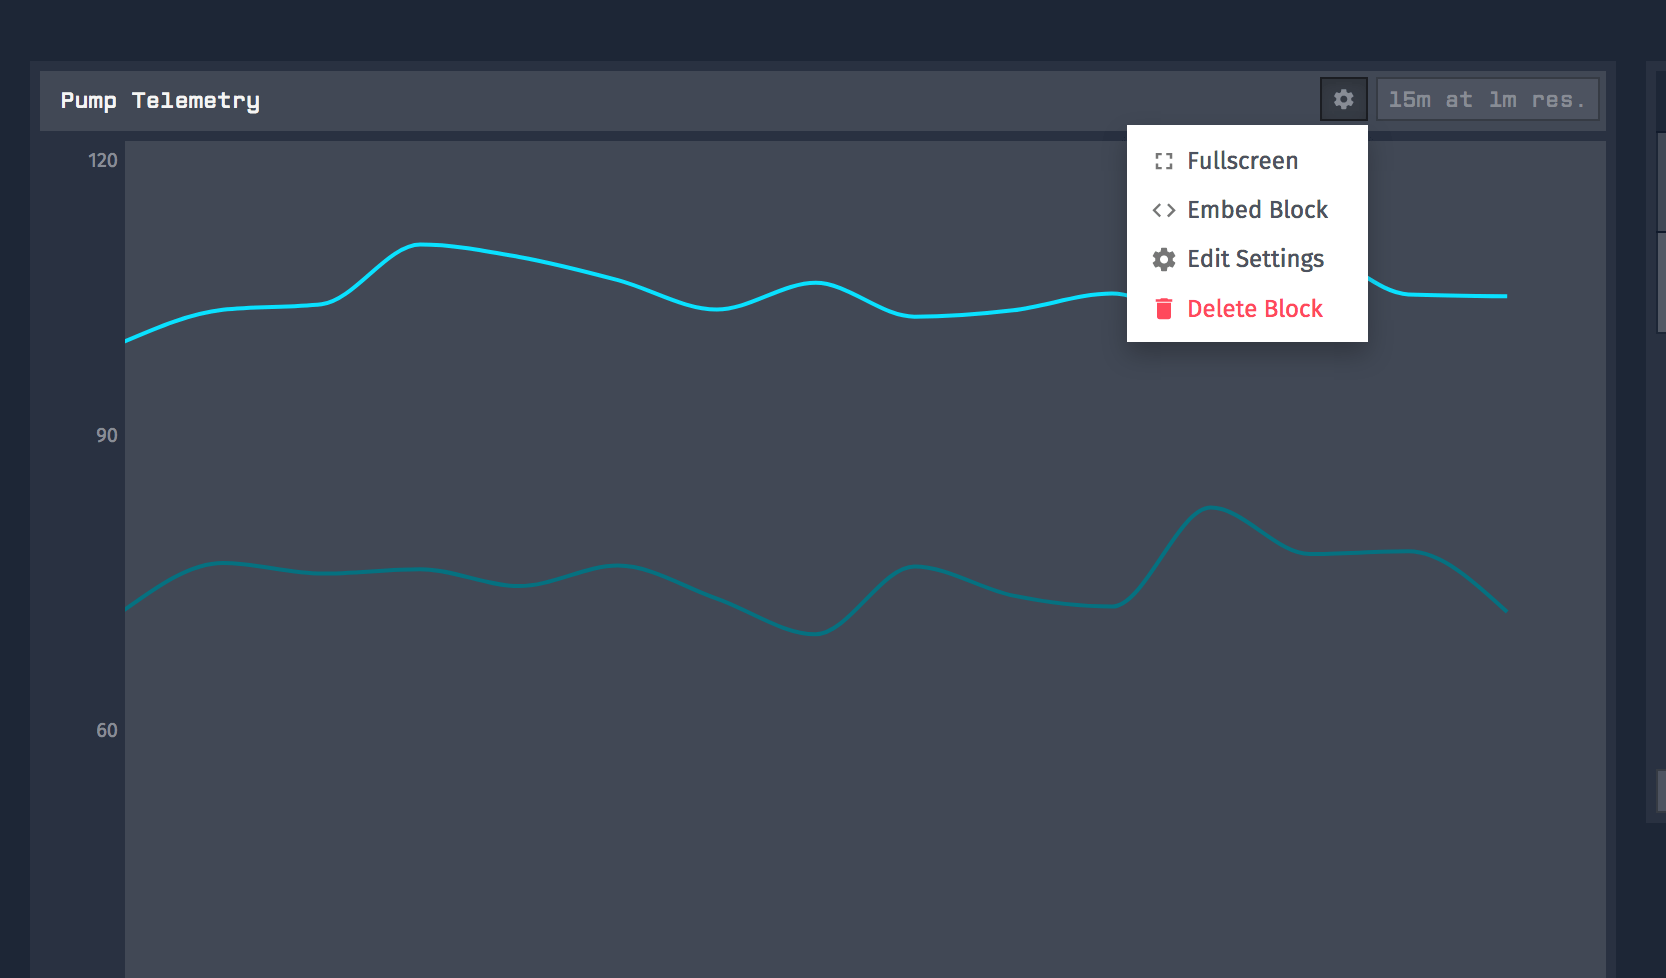
Next, update the block data to use the context variable {{ctx.deviceId}} instead of the individual device:
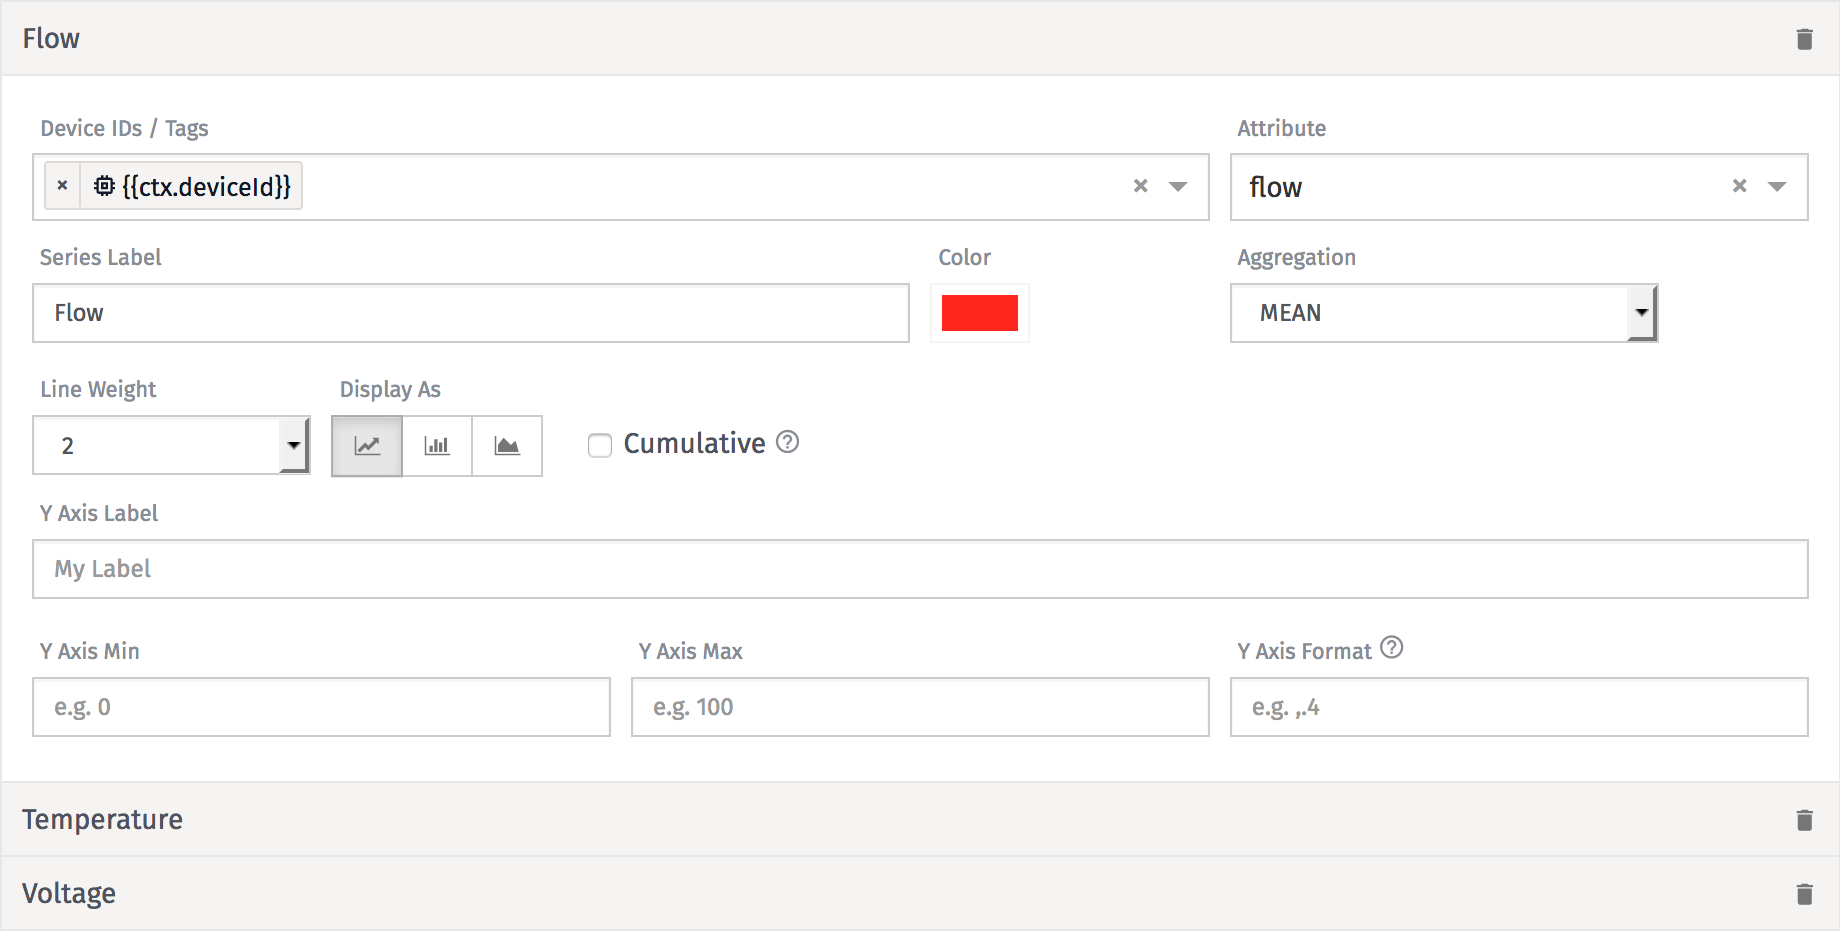
This tells the block to use the context of the dashboard as the device. So, we can switch the context of the dashboard, and our blocks will update as well.
Time Series Context Variable Exercise:
Update the other segments of the block to use the deviceId context.
Changing Context
Let’s save this block and go back to the dashboard:
Notice one thing, it (more specifically the Time Series Block) looks the same! This is because, since we haven’t provided a context yet, our dashboard is using the default value we input into the context variable settings.
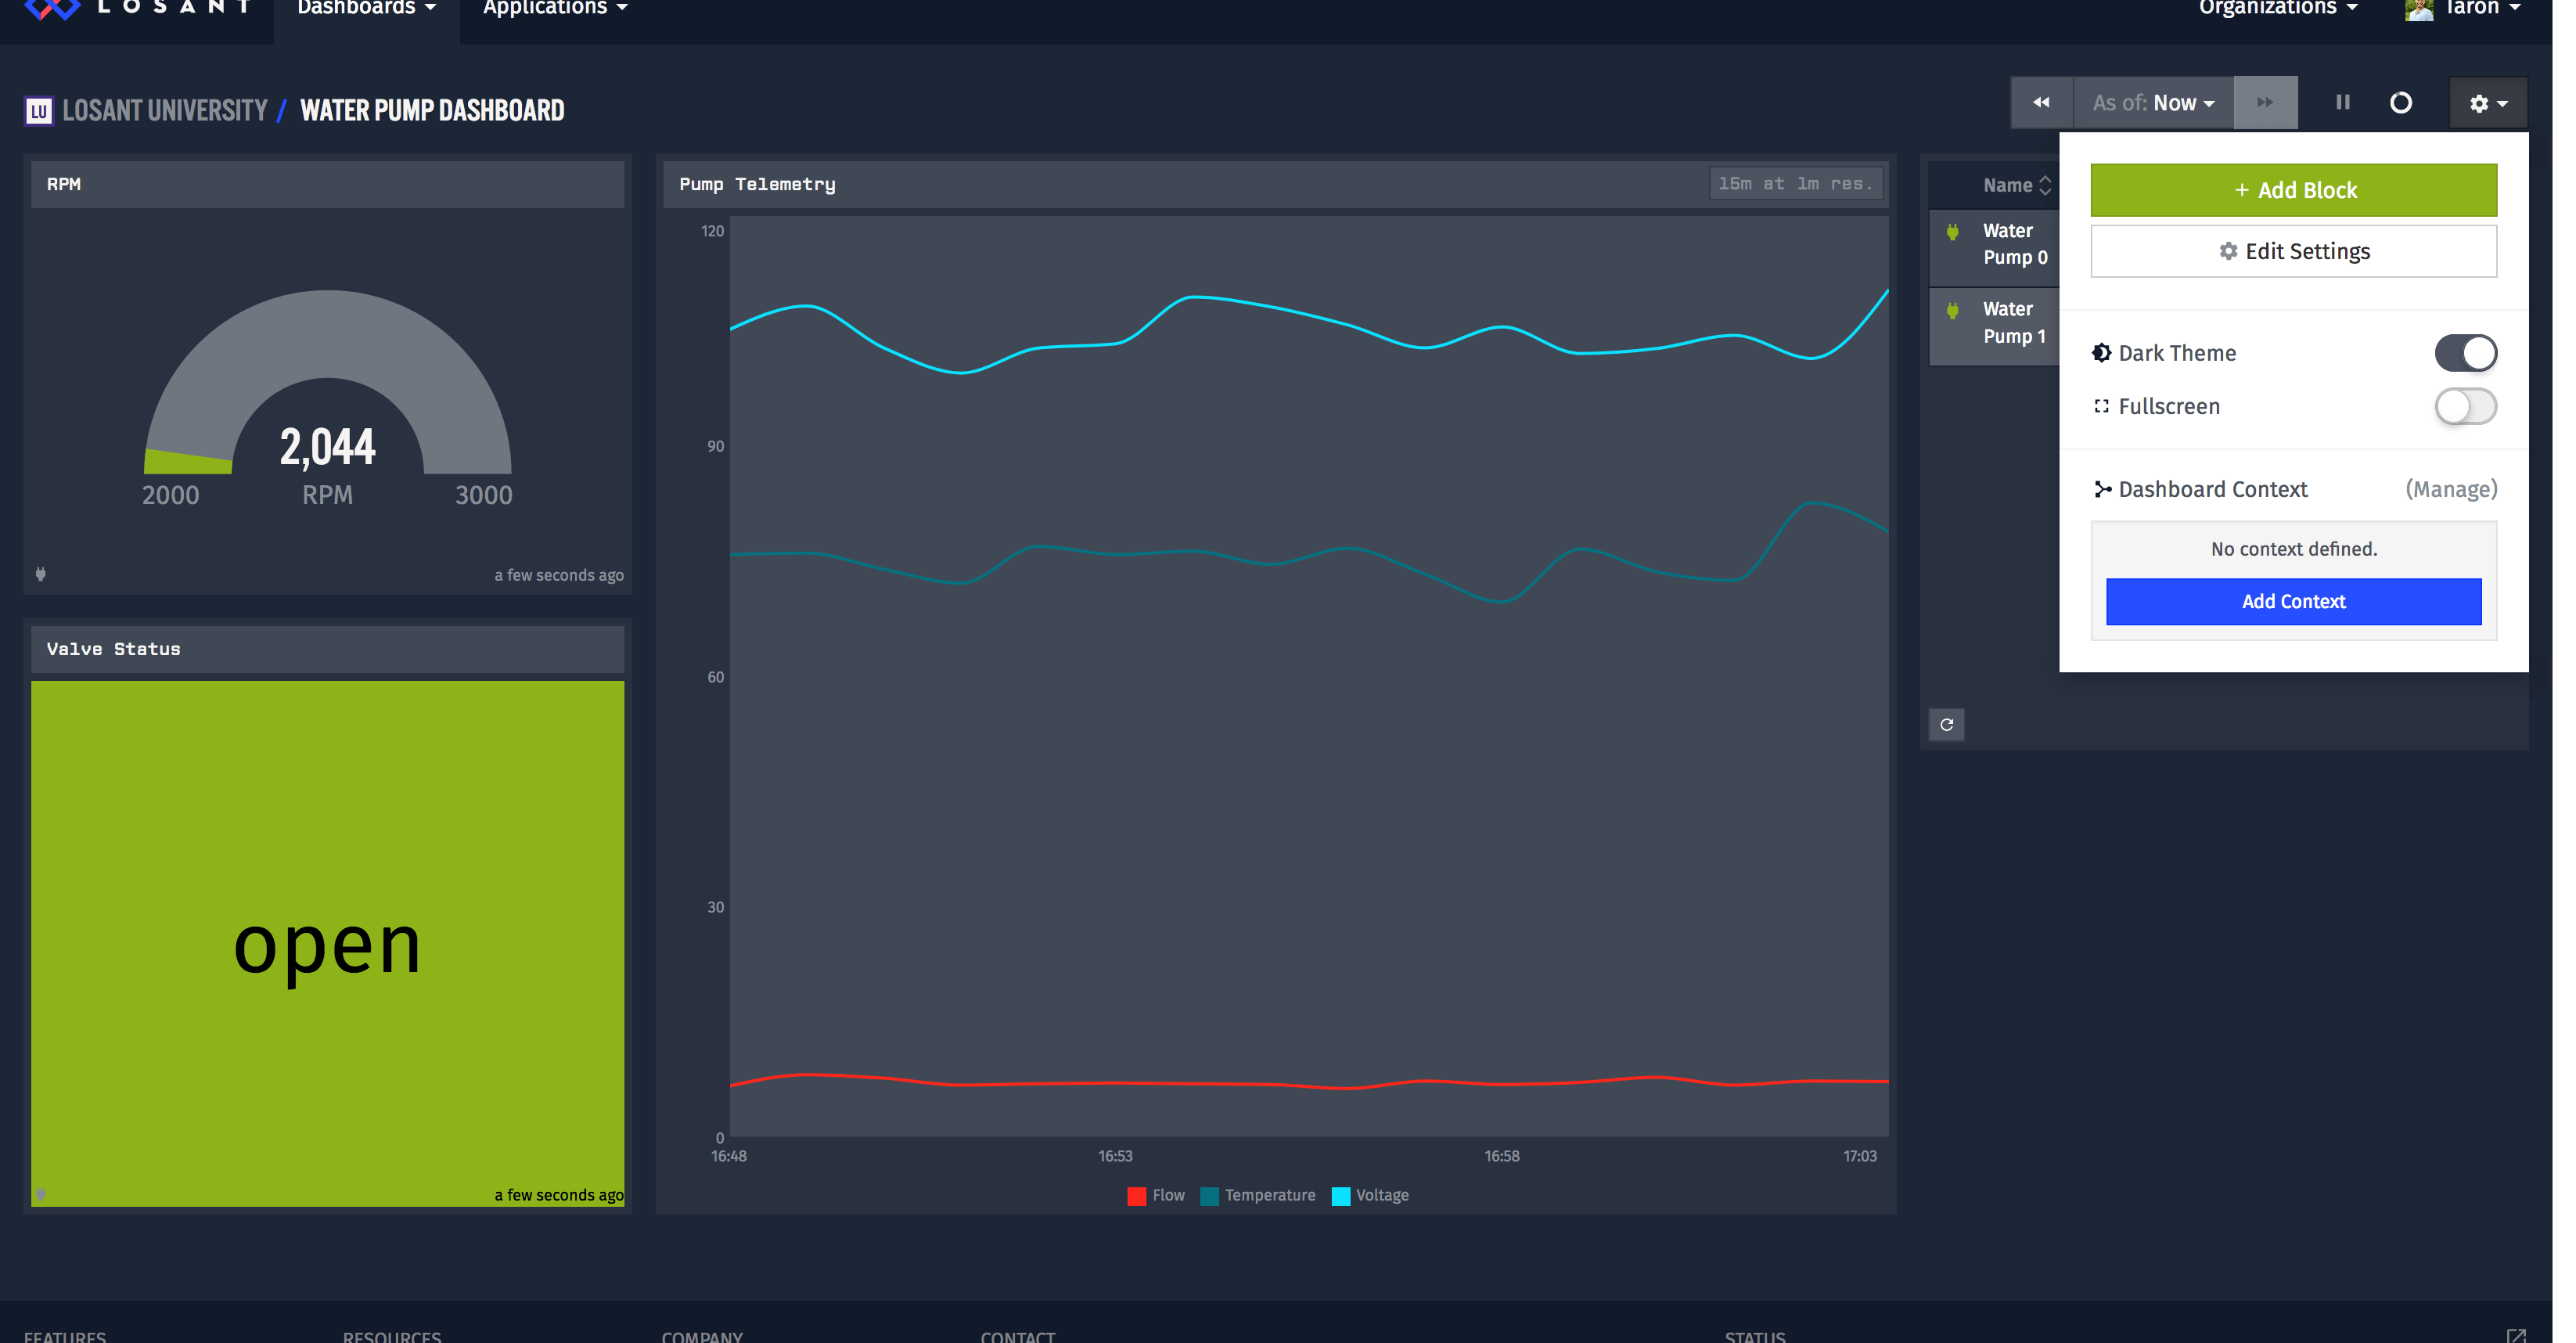
To change the context, take a look at the dashboard settings:
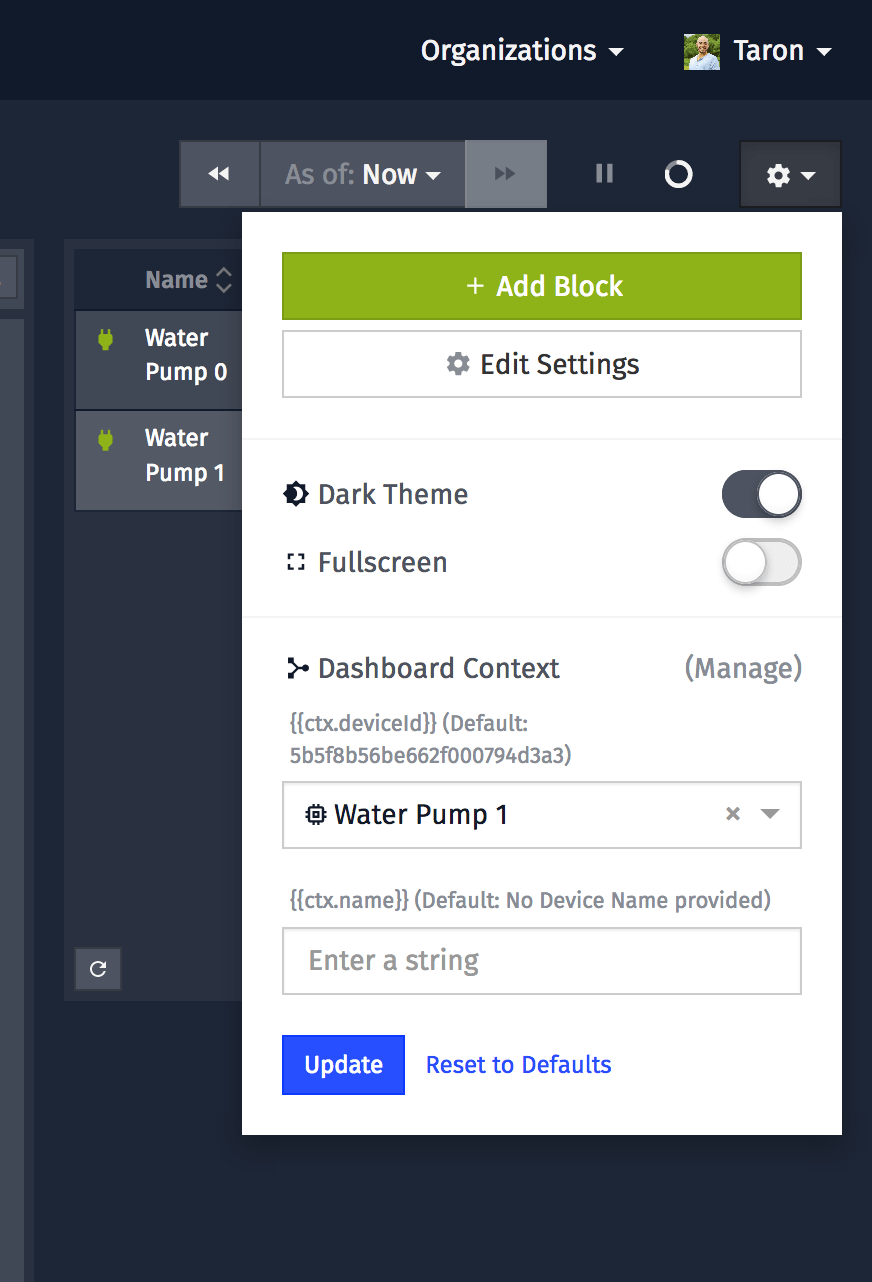
There, we can see two new fields. Change the deviceId context using the dropdown and see what happens.
The Time Series Graph should change to reflect the new device. Our other blocks aren’t updating because they are not using the deviceId context variable yet.
Context Variable Exercise:
Update all the blocks (except for the Device List Block) to use the deviceId context variable.
Once done, let’s update the Device List Block.
Update Device List Block
If you recall, we can have the items in the Device List block link to a custom URL. We can use this feature to have the items in this list link to their own dashboard with the appropriate context. When you change the context of the dashboard, Losant appends the URL with query data that represents the context:
?ctx[deviceId]=5b5f8c5796a6a400067a2046
Taking advantage of this, we can configure the context of the dashboard based on a link in the device list block (instead of using the settings button each time).
Open your Device List Block settings:
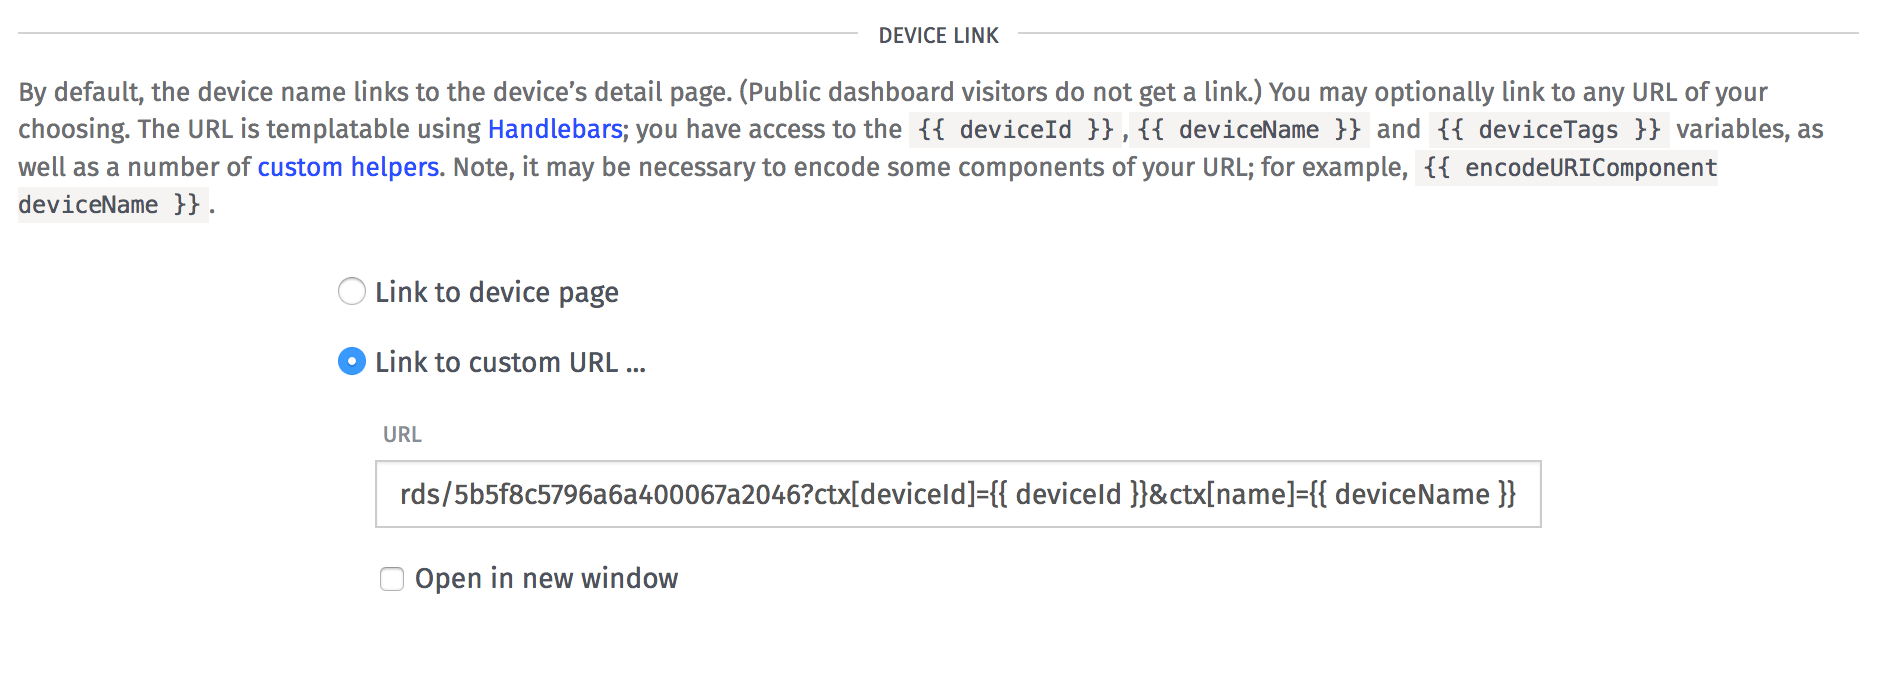
Choose “Link to a custom URL”.
Here you want to paste in your dashboard URL and append the context variables like so:
https://app.losant.com/dashboards/5b5f8c5796a6a400067a2046?ctx[deviceId]={{ deviceId }}&ctx[name]={{ deviceName }}
Make sure you change https://app.losant.com/dashboards/5b5f8c5796a6a400067a2046 to the link of your dashboard.
In the link above, we see {{ deviceId }} and {{ deviceName }}. These are special variables that the Device List Block provides (take a look at the “Device Link” section’s description).
So, in the Device List Block, our links will render like so:
https://app.losant.com/dashboards/5b5f8c5796a6a400067a2046?ctx[deviceId]=5b5f8b56be662f000794d3a3&ctx[name]=Water Pump 0
Now, save your block with your new custom URL.
It will look exactly the same, but when you click the name of the pump, you will be taken to a dashboard with the context of this device!
Add Section Header
We haven’t used our name context yet. Let’s use it in a Section Header Block to display the name of the device we are currently looking at.
Here are the block settings for the Section Header Block:
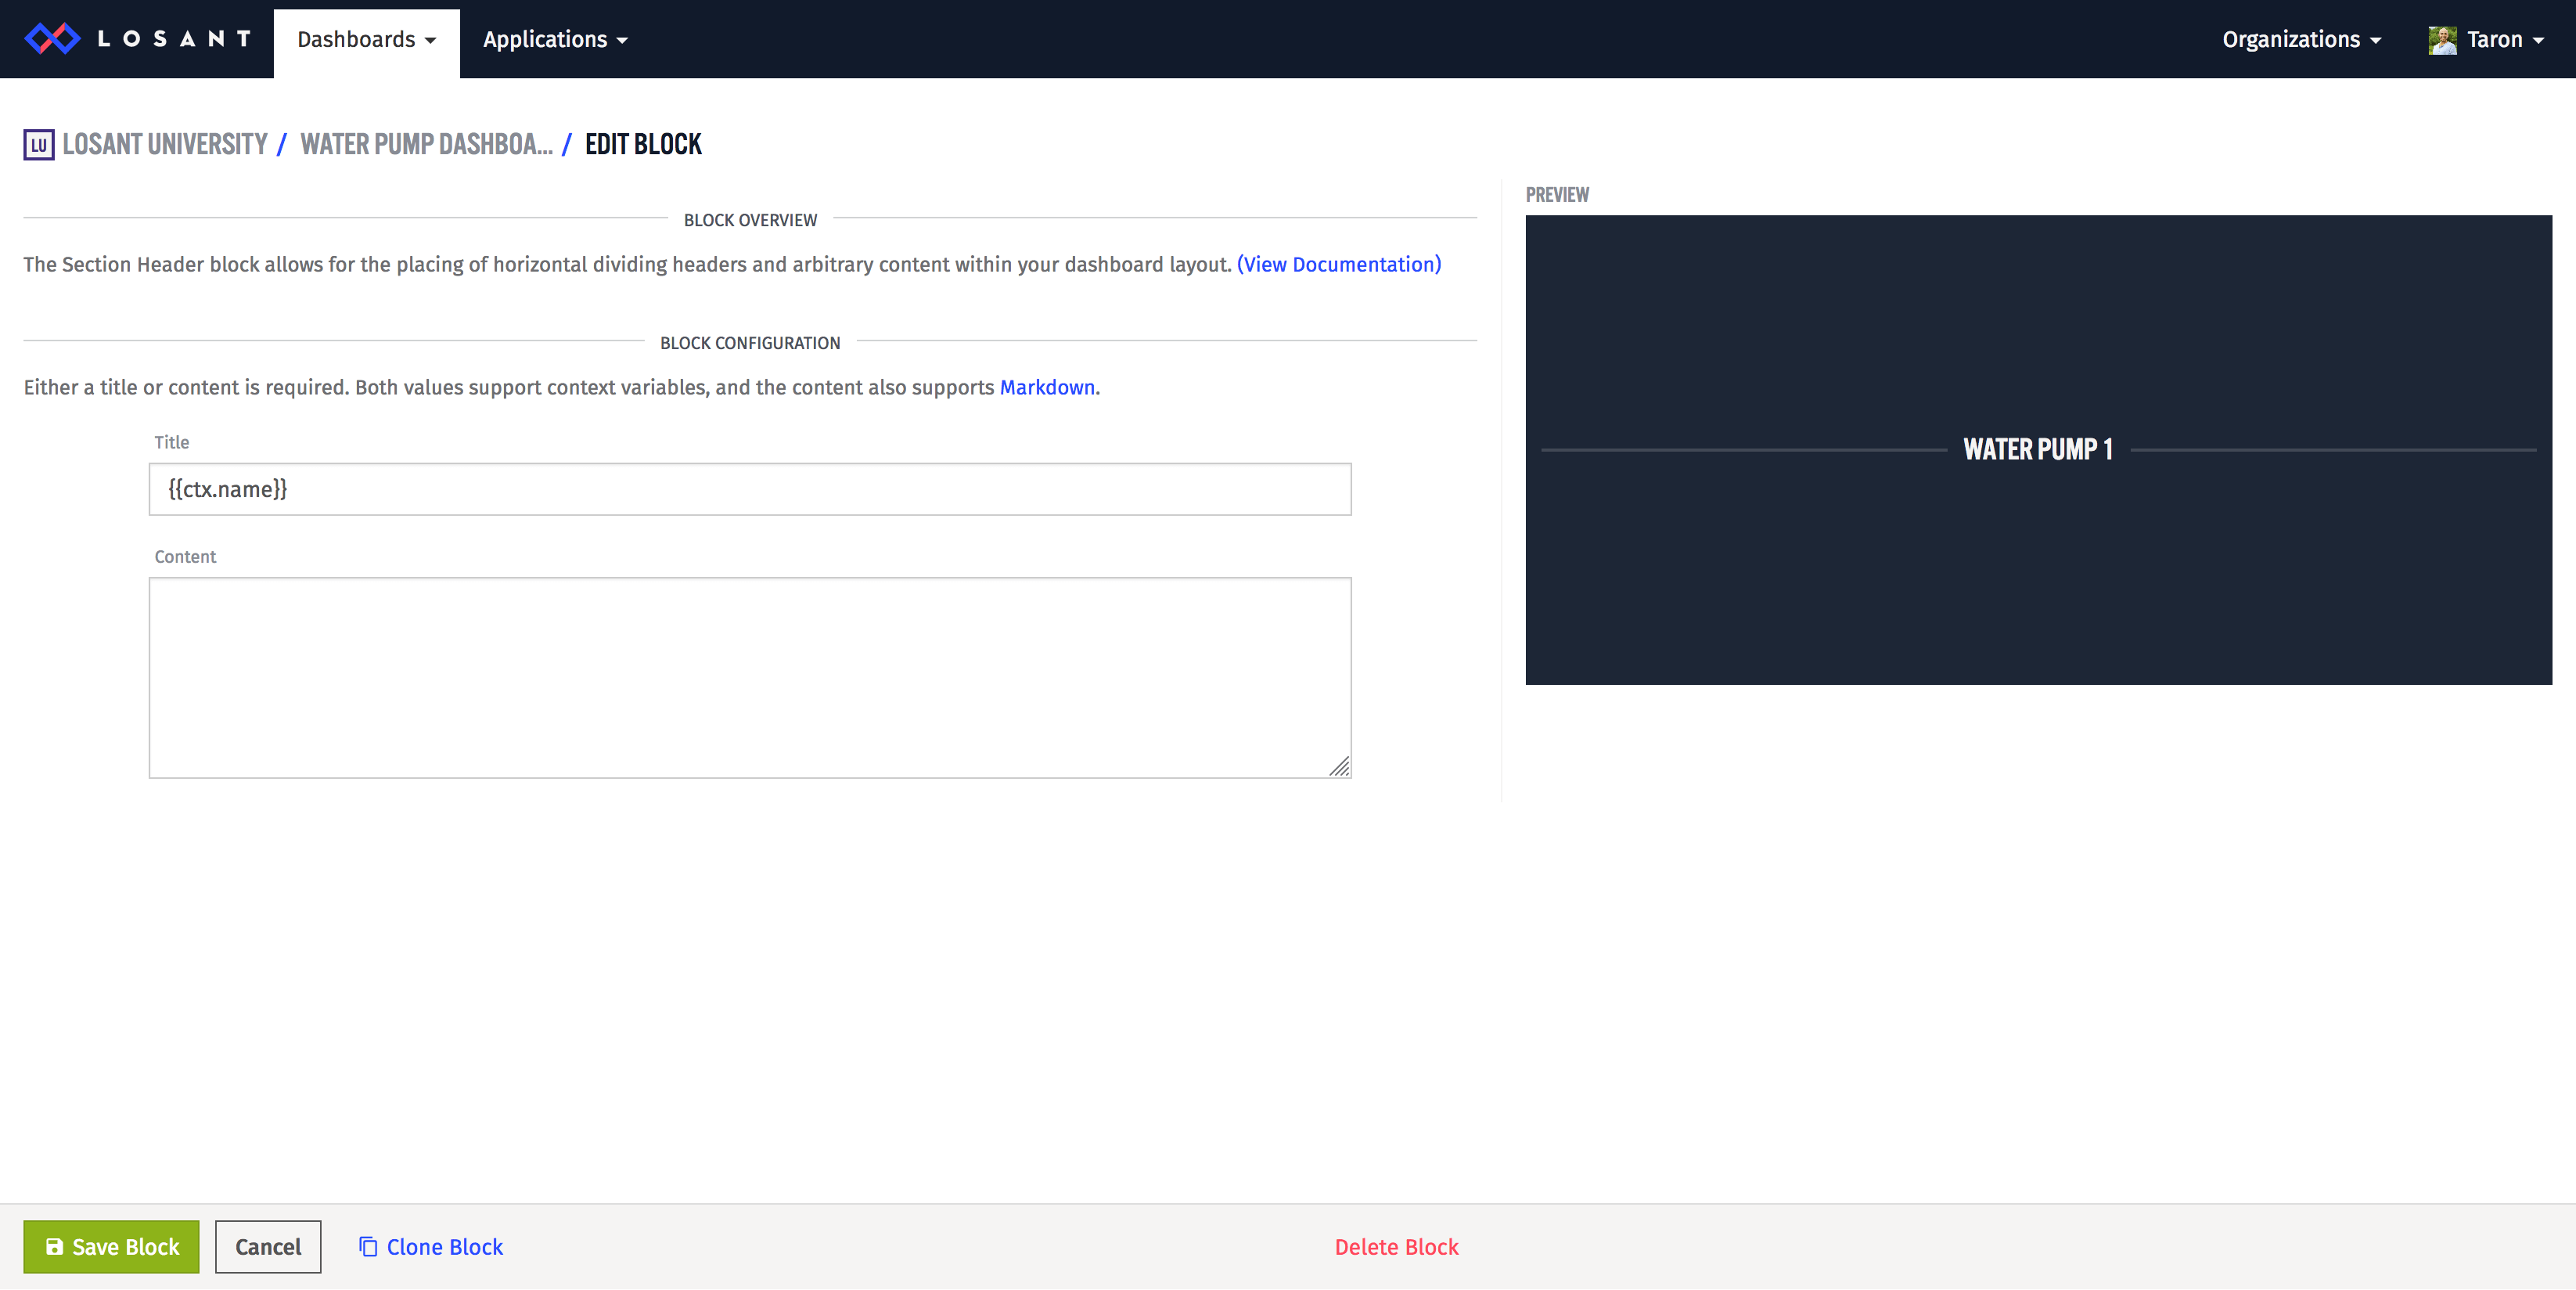
Set the title to {{ctx.name}}.
In the preview, you should see it update with our default device.
All Done
Now, we can add hundreds and thousands of pumps and each will have their own dashboard. Better yet, this dashboard never has to change to accommodate all of our new pumps.
What's Next?
Congratulations, you are now officially done with Course 4 of Losant University!
Feel free to poke around Losant; there is a ton to explore. If you run into any troubles along the way, the Documentation and Forums are there to help.
Was this page helpful?
Still looking for help? You can also search the Losant Forums or submit your question there.