GPS History
The GPS History Block shows the path of GPS data points across one or more devices. The map visualizes the historical path of each device as a connected line, with a start and end bubble.
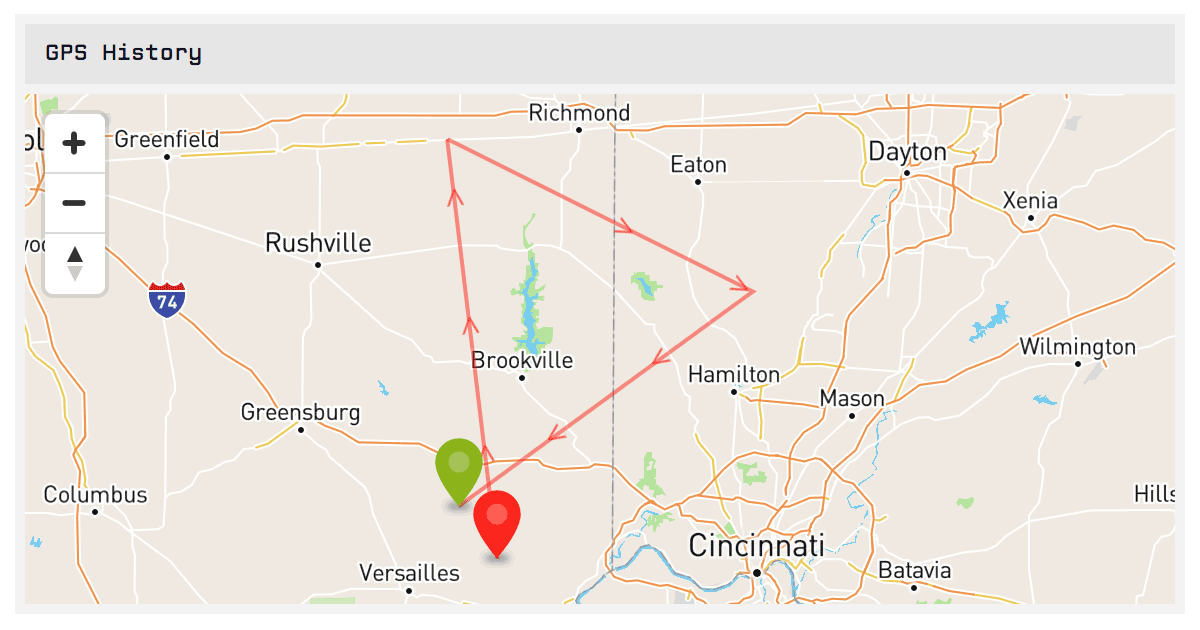
The map will automatically pan and zoom to display all the available data retrieved for the block’s configuration. However, you are free to pan and zoom the map on your own.
Devices
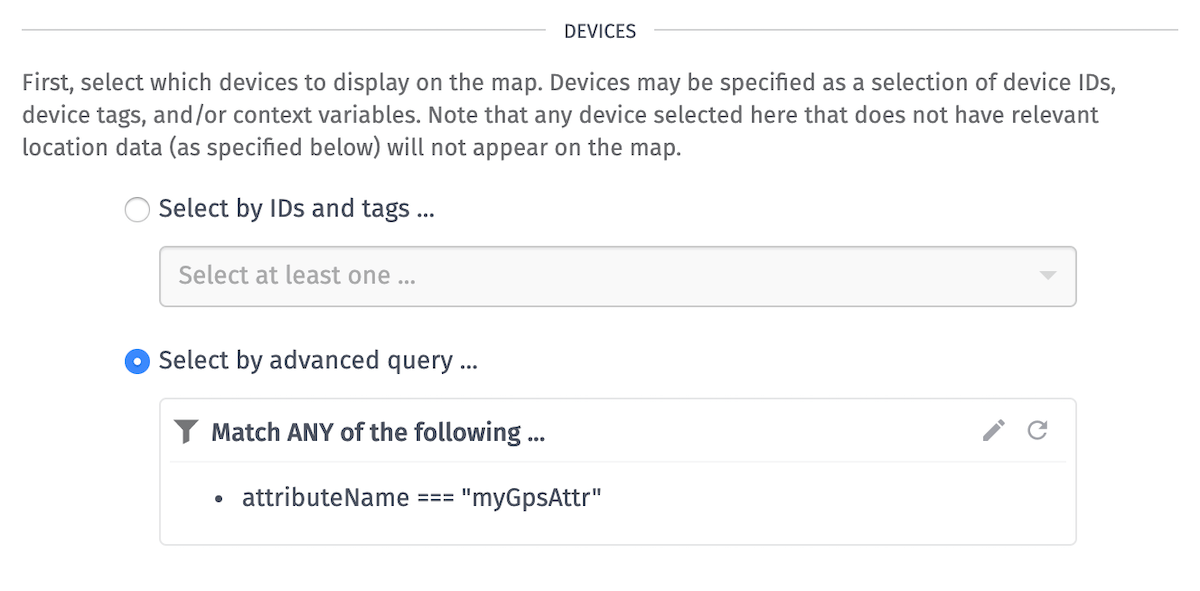
First, select one or more devices to display on the map using a device query. Any device matching the query must also have location data available through the specified data source in order for it to appear on the map.
Map Data Source and Duration
Any device selected that does not have a relevant data source will not appear on the map.
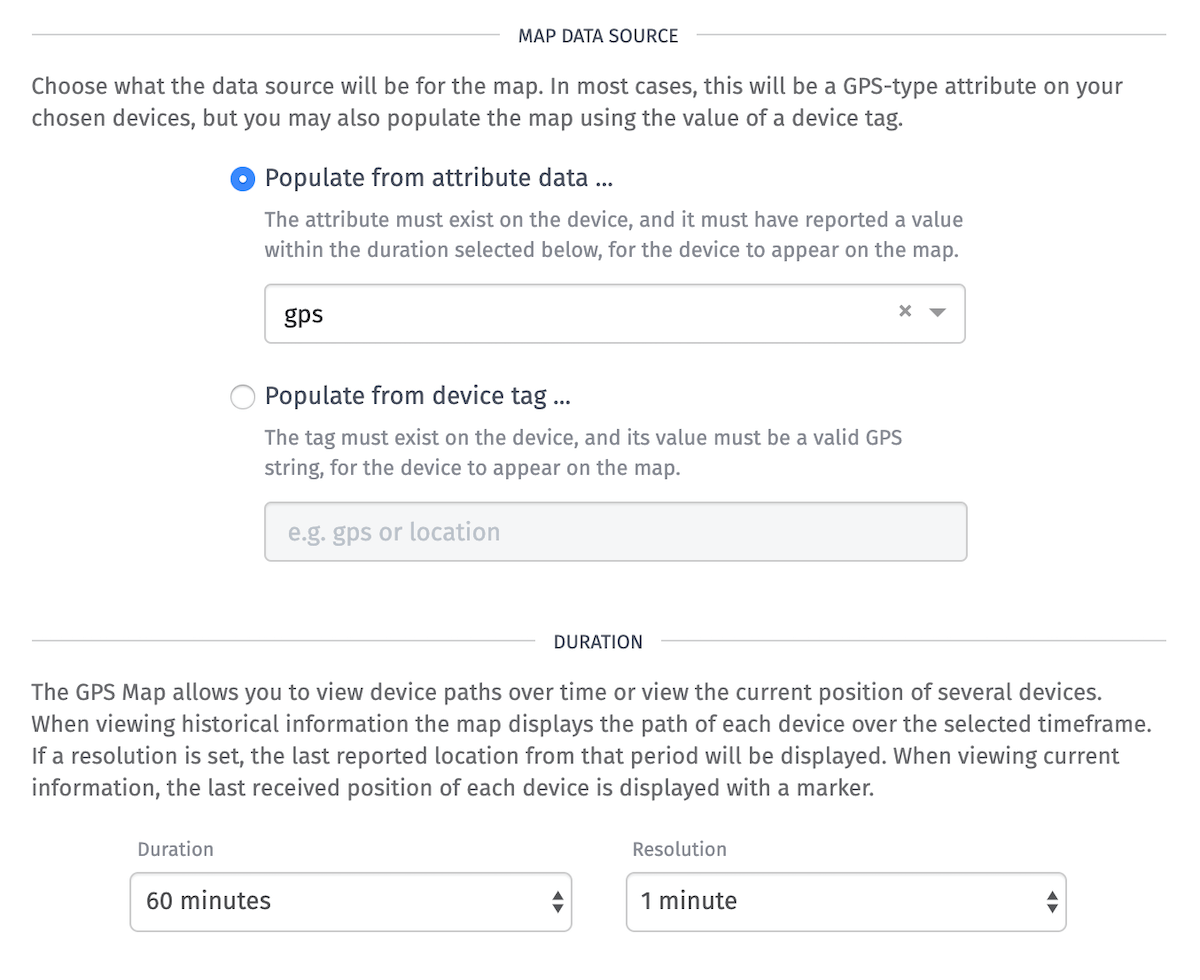
You may choose either “Populate from attribute data” or “Populate from a device tag”.
Populate from attribute data
If you use an attribute as your data source, you must choose a “Duration” and “Resolution”.
Duration—how far back in time you’d like to view.
Resolution—how far apart individual data points are. Selecting “1 minute” for example means you’ll see a data point for every minute. This will return only the last data point per resolution period, omitting the other recorded data. Selecting a larger resolution helps optimize dashboard performance for devices with a larger volume of location data.
To view the current location of your devices, select “Last received data point”. This will show each device on the map as a single pin.
To view your devices’ locations over a given period of time, choose any other value for duration. Your devices will show on the map as red starting point pins and green ending point pins, with paths connecting the two showing how the device traveled over the given duration.
Populate from a device tag
If a device has a static location, it’s common to use a device tag to represent the location of the device. In that case, you may select a tag to represent the location of the device on the map.
The tag must exist on the device, and its value must be a valid GPS string, for the device to appear on the map.
Data Attributes
You may select additional attributes to load with this block. These are in addition to the GPS attribute referenced above for populating the map’s data source.
This is helpful if you would like to display other attribute data within the advanced pin style and/or popup configuration.
Additional Attributes
To optimize the performance of devices with a large number of attributes, you can control what attributes the device returns along with the location data.
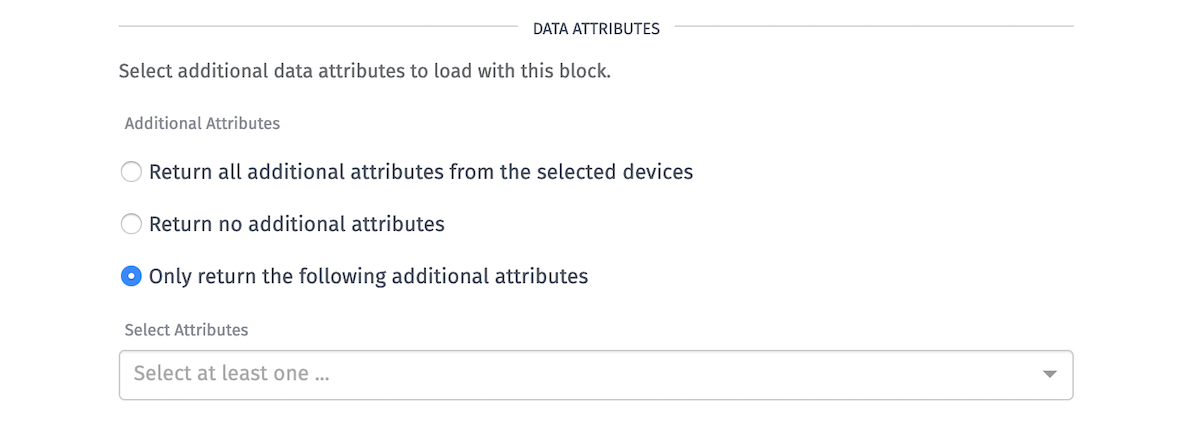
Return no additional attributes—(Default) No additional attributes will be queried.
Return all additional attributes from the selected devices—Every attribute on the devices will be returned.
Only return the following additional attributes—Choosing specific attributes to return from the device.
State Properties
If “Return all additional attributes from the selected devices” is selected, you must configure the “State Properties”.
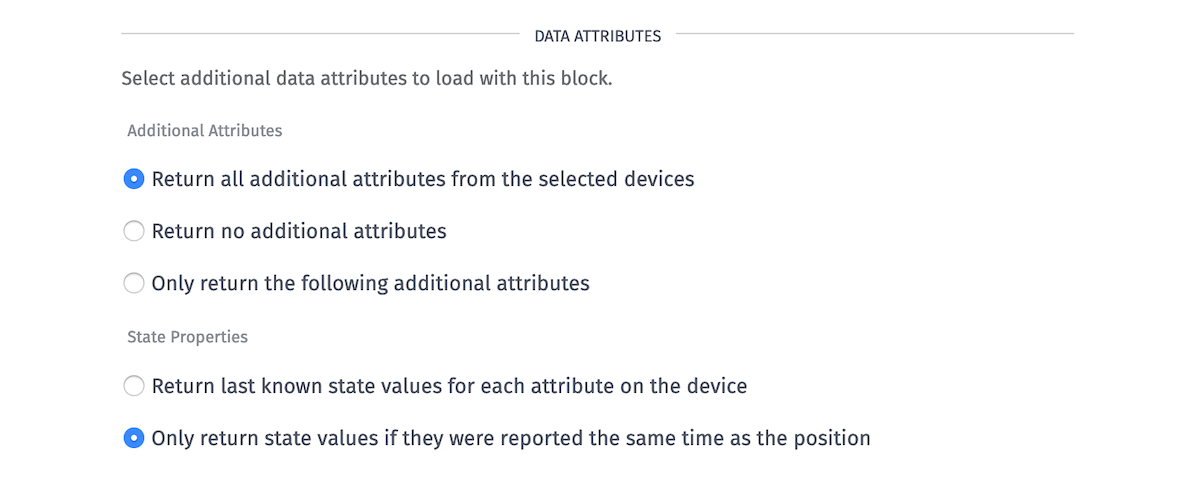
Return last known state values for each attribute on the device—(Default) The attributes available return the most recently received value for that attribute at the time of any GPS point.
Only return state values if they were reported the same time as the position—Only provide attributes that were reported at the same time as the GPS state report. In this case, other attributes that were not reported along with the GPS data will return undefined.
Default Viewport
Set the default viewport for the block.
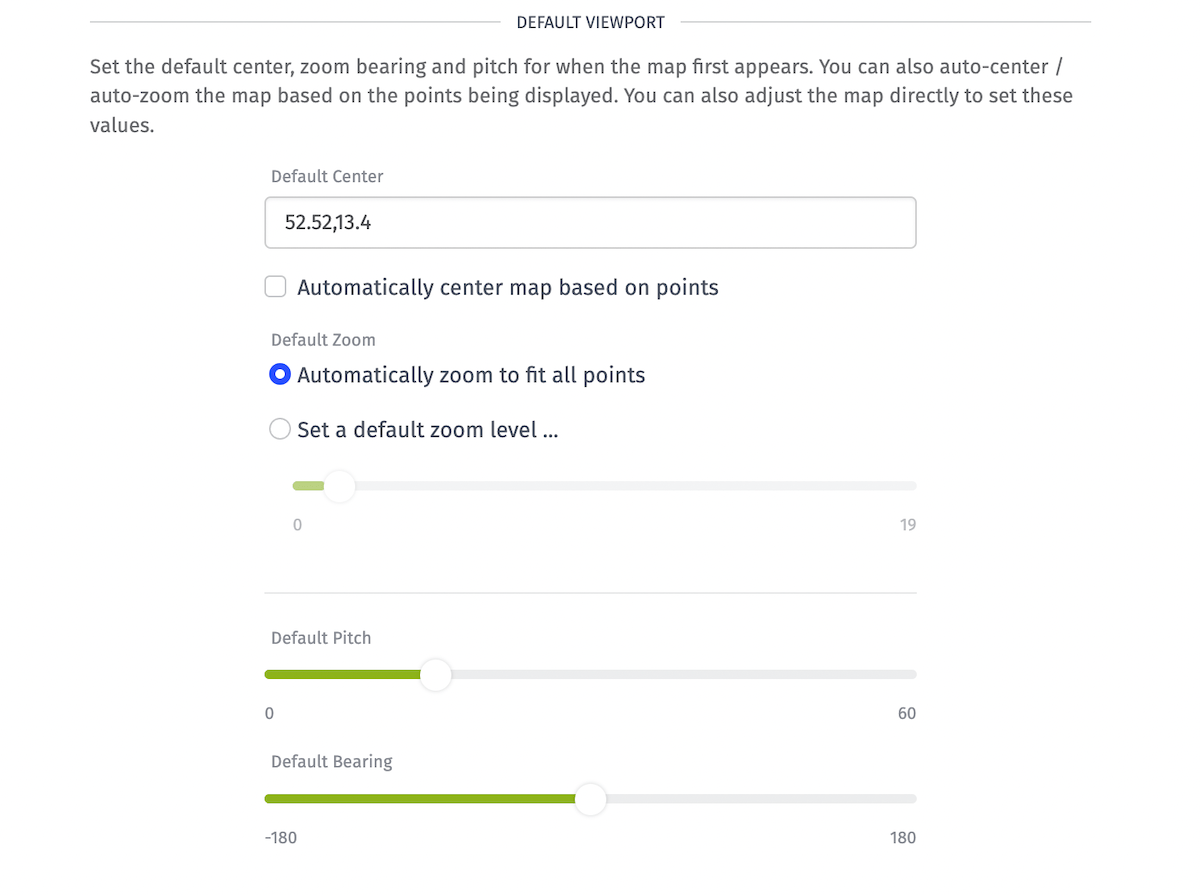
You can also interact with the map in the block preview and pass its settings to the block configuration by clicking the “Set” button.
Default Center—You can enter a GPS string to set the default GPS location for the map to center on. If no value is provided, the map will default to the center of the United States. Checking “Automatically center map based on points” will center the map on the data you are displaying once it has loaded.
Zoom—Automatically zoom the map to display all points returned by the query, or set a manual zoom level.
Bearing—Set a default bearing, where 0 points north to the top of the map, and values between -180 and 180 swing the map in either direction.
Pitch—Set a default pitch for the map, between 0 (straight overhead) and 60 degrees.
Once a user manually pans or zooms the chart in the dashboard view, the default settings are disregarded until the dashboard is reloaded.
Default Map Style
You may choose a particular default map tile set. The two current styles available are “Normal” and “Satellite”.

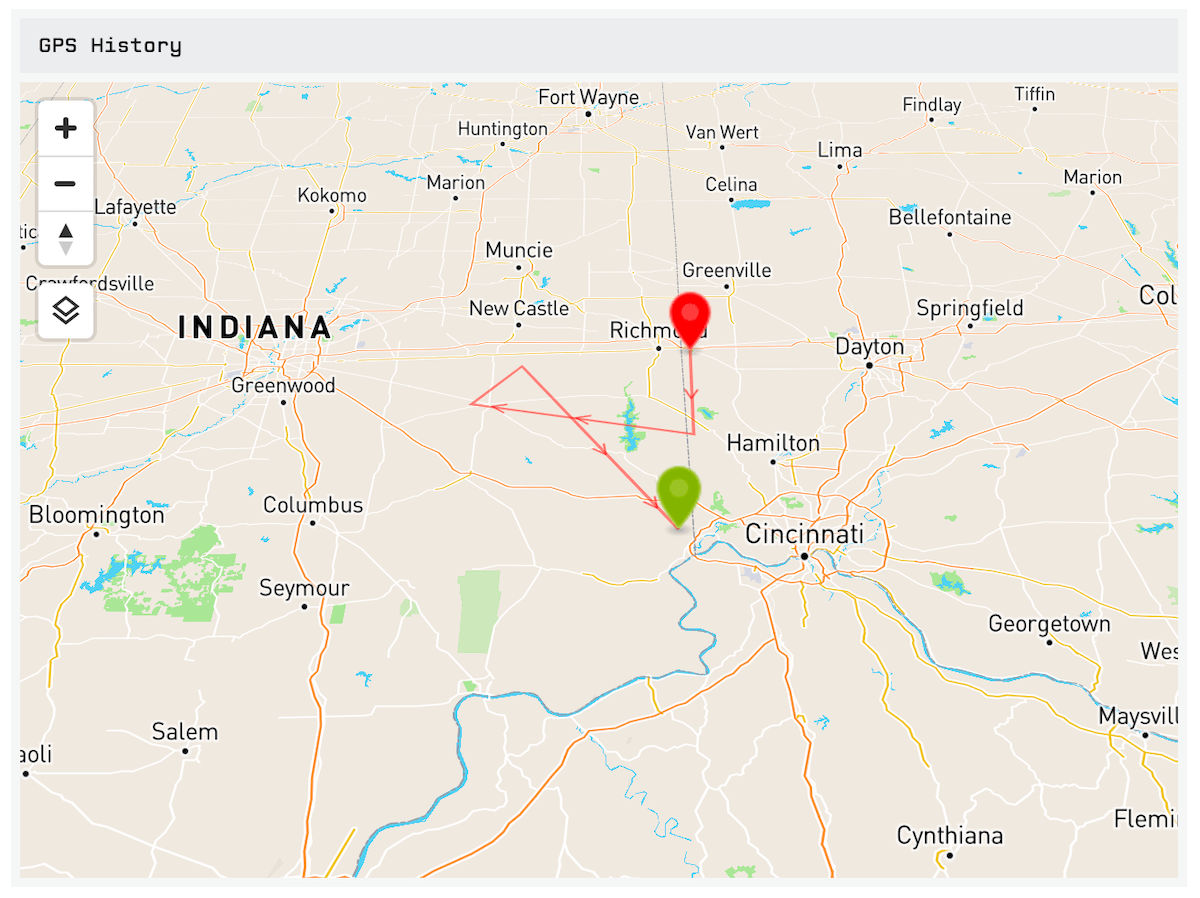
Normal—a standard vector map with streets and labels, and changes from a light to a dark style depending on the theme chosen for viewing the dashboard. Preview:
Satellite—uses satellite imagery to display the map with streets and labels overlaid on top - the satellite style does not have themes for light or dark, and remains the same no matter what theme is chosen for the dashboard. Preview:
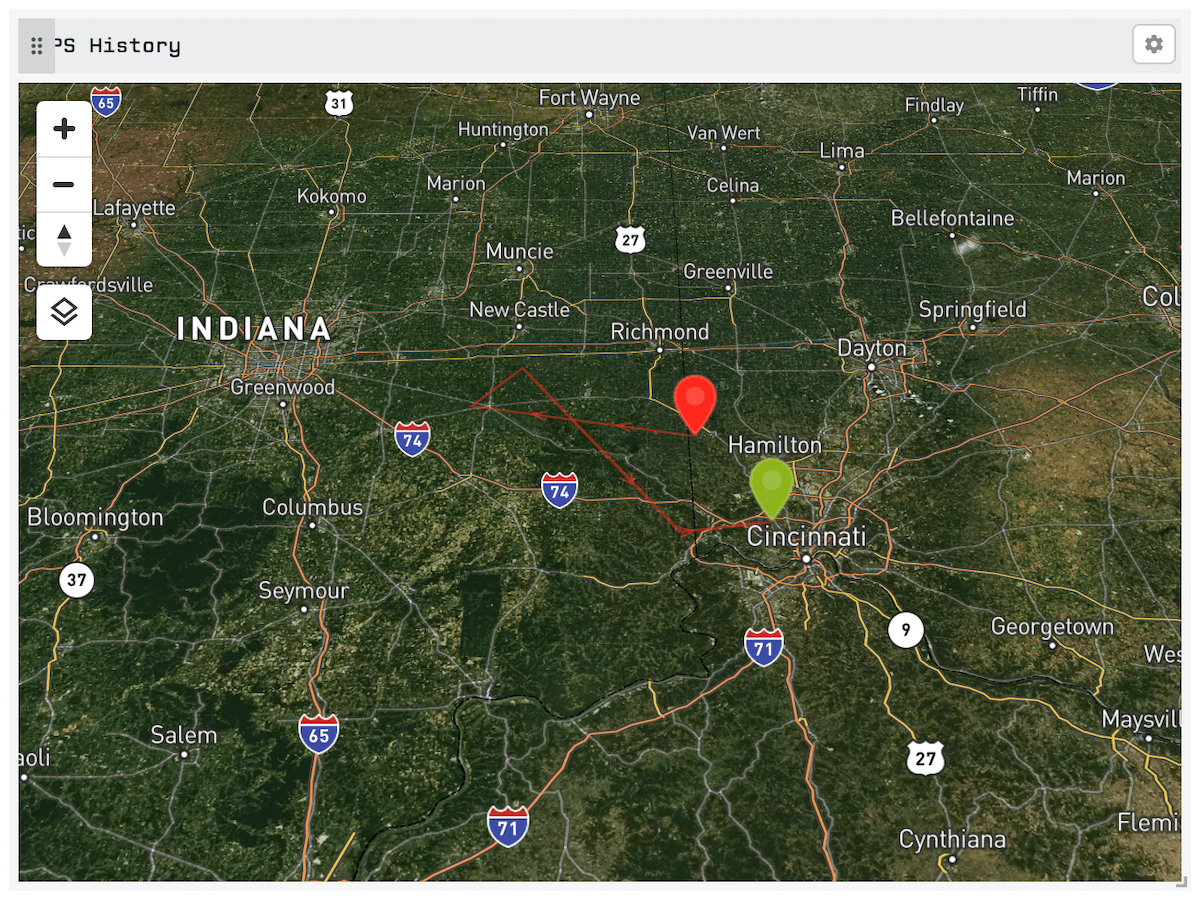
You are be able to toggle the map type from the dashboard view, but the map will always load with the default style chosen here.
You may also “Include arrows on paths showing the direction of travel” on your history lines to show the direction of movement between your GPS points (shown in the screenshots above).
Point Display Configuration
You may customize the pins for points on the map and the popups that appear when clicking on a map pin.
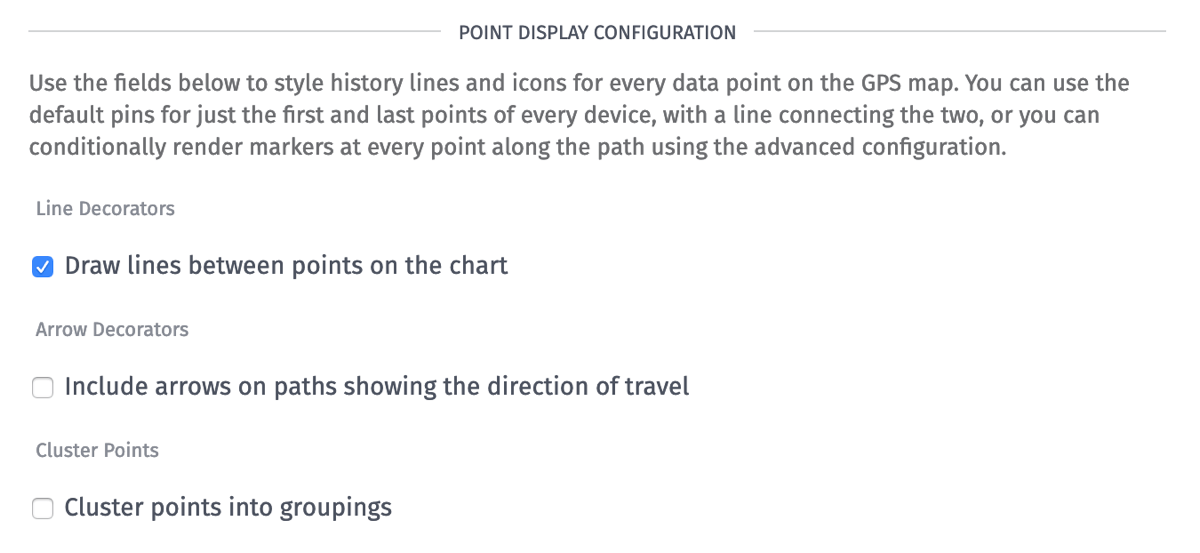
Line Decorators
By default, the block draws lines between data points on the map if you are you are looking at a duration of data other than “Last Received Data Point”. You can remove these lines so that only individual data points will be displayed.
Arrow Decorators
Optionally, if line decorators are enabled and you are looking at a duration of data other than “Last Received Data Point”, you can enable arrow decorators to show which direction your connected device was moving along the line.
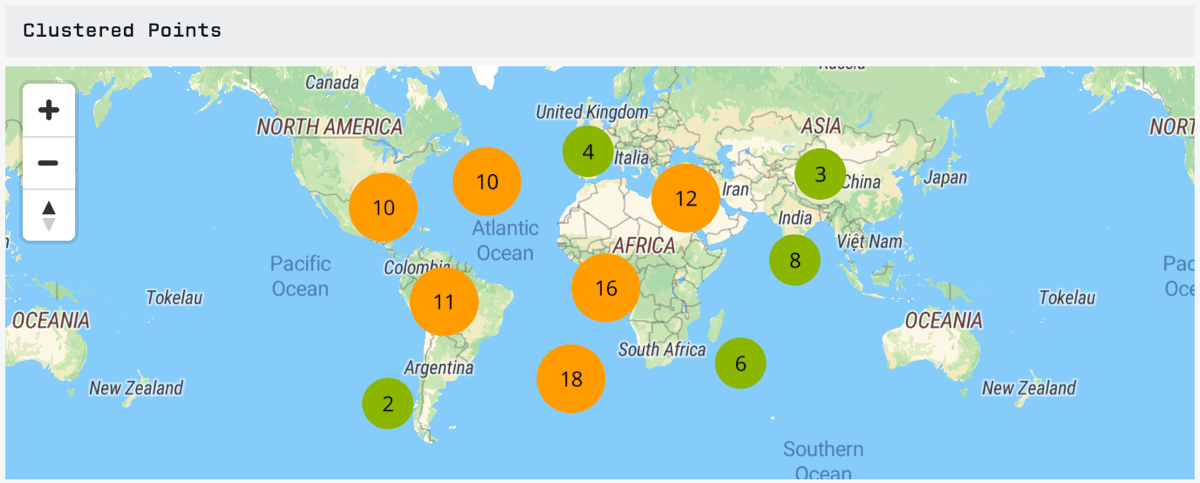
Cluster Points
Optionally, if you are using the duration of “Last Received Data Point” (and so only one data point appears on the map per device), you can enable point clustering. This will cluster points together into groups depending on your zoom level, and you can click on a cluster to zoom into that cluster.
Simple Pin Style Configuration
By default, Losant places a red marker at the oldest (starting) point for a series and a green marker at the most recent (ending) point for a series.

You can change the color and the transparency of either pin using the color picker for that pin, and the change will apply to all of the relevant start or end pins on the map.
Advanced Pin Style Configuration
If you want more control over marker pins, you can select “Advanced”.
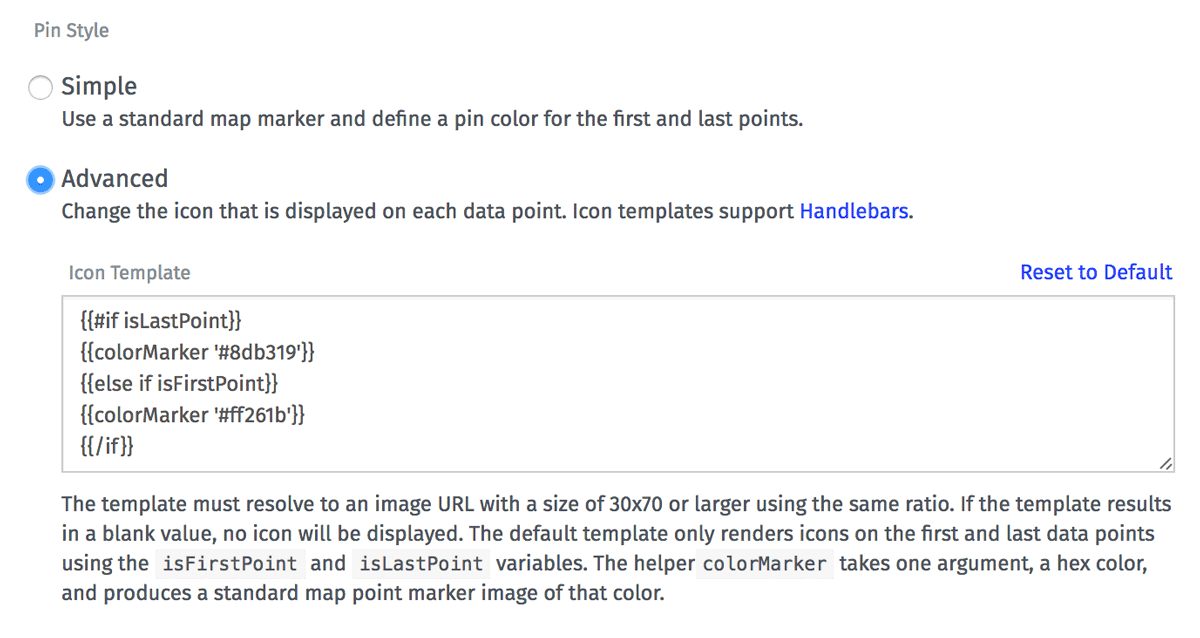
This allows you to provide a string template for each individual point in each series displayed on the map.
The string template must resolve to a single URL pointing to an image, and the pin will be rendered using the image’s natural width and height. If the template does not resolve to an image, no marker will be displayed for that point.
You may use the helper function colorMarker to create the same kinds of markers that the “Simple” configuration uses. The default template for the advanced section uses this helper:
The colorMarker helper takes a single argument, which is a hex color string, and returns an image URL for a marker of that color.
Using conditional block helpers and templating variables, it renders a red marker for the starting (oldest) point of a series, and a green marker for the ending (most recent) point of a series.
For SVG images, a width and/or height must be explicitly assigned in the outermost <svg> element in order to render.
Marker images also support images optimized for retina displays. Any image with @2x or @3x immediately before the file extension will render at half or a third of its original size respectively.
Popup Style Configuration
The popup configuration allows you to provide a string template that can be used for rendering the popup for a point.
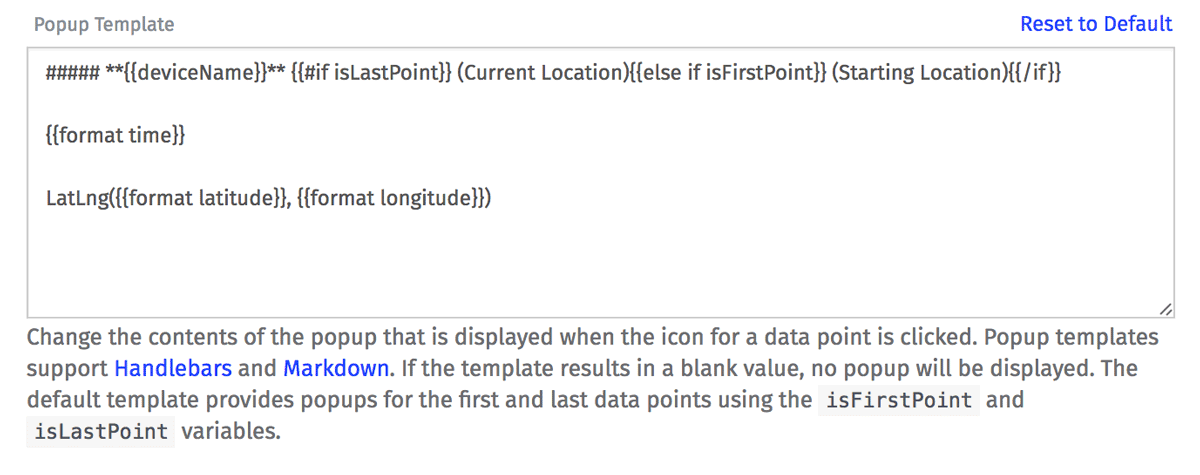
The popup for a point will only be available if there is a pin for that point, make sure that a pin is rendered for any points that you want to provide a popup for. Device attribute data is only available in the popup pin when it is reported in the same state as the GPS attribute.
Markdown
String templates for popups are treated as Markdown, allowing for formatting options such as bold and italic.
Using Losant’s built-in Handlebars helpers, it is possible to build quite complex popup templates that include images and links. You can also display items conditionally
By default, using the templating variables, the popup template renders simple text with the device’s name, timestamp of the point, and lat/lng location of the point. If the template renders to an empty string for a point, no popup will appear when clicking the map pin for that point.
Templating Variables
When using the advanced pin style or the popup style configuration, the following variables are available for you within templates:
isFirstPoint- True if this is the first (oldest) data point in the series.isLastPoint- True if this is the last (most recent) data point in the series.index- Index of the current data point in the series.deviceName- Name of the device that generated this data point.deviceId- Id of the device that generated this data point.deviceTags- The tags (as an object) of the device that generated this data point.latitude- Latitude of the current data point.longitude- Longitude of the current data point.time- Time of the current data point.data.<attributeName>- Value of given attribute at this data point.
The same variables exposed in the advanced pin style configuration are also available in the popup configuration.
Was this page helpful?
Still looking for help? You can also search the Losant Forums or submit your question there.
