Gateway Edge Agent Workshop

Welcome to your workshop on Losant's Gateway Edge Agent (GEA). The purpose of this workshop to get your hands dirty with the GEA. In the course, we installed the GEA, reviewed usage, and covered some of the edge-specific nodes. Now, let's put some of that to use in our example.
Review
First, let’s recall the story of the application we are building:
Embree is launching an initiative to adopt IoT and offer new capabilities to their customers. Currently, Embree produces water pumps for industrial use cases like mining, construction, and oil & gas. Their goal is to gain deeper insight into the pumps and provide more value to their customers.
To begin the new initiative, the Embree team decided to start with a proof of concept, which will enable them to solve a small, useful problem to get results faster. For this first project, Embree wants to take one of their existing pumps and send the data it’s collecting, like flow rate and temperature, to the cloud.
To build this proof of concept, they chose to use Losant. They chose Losant because the user experience would allow them to build this proof of concept in no time and they could easily build new applications with the insights gained.
In Course Three, we created a device that represents our water pump with the following attributes:
- Battery Voltage
- Valve Status
- Flow (liters per second)
- Temperature
- RPM
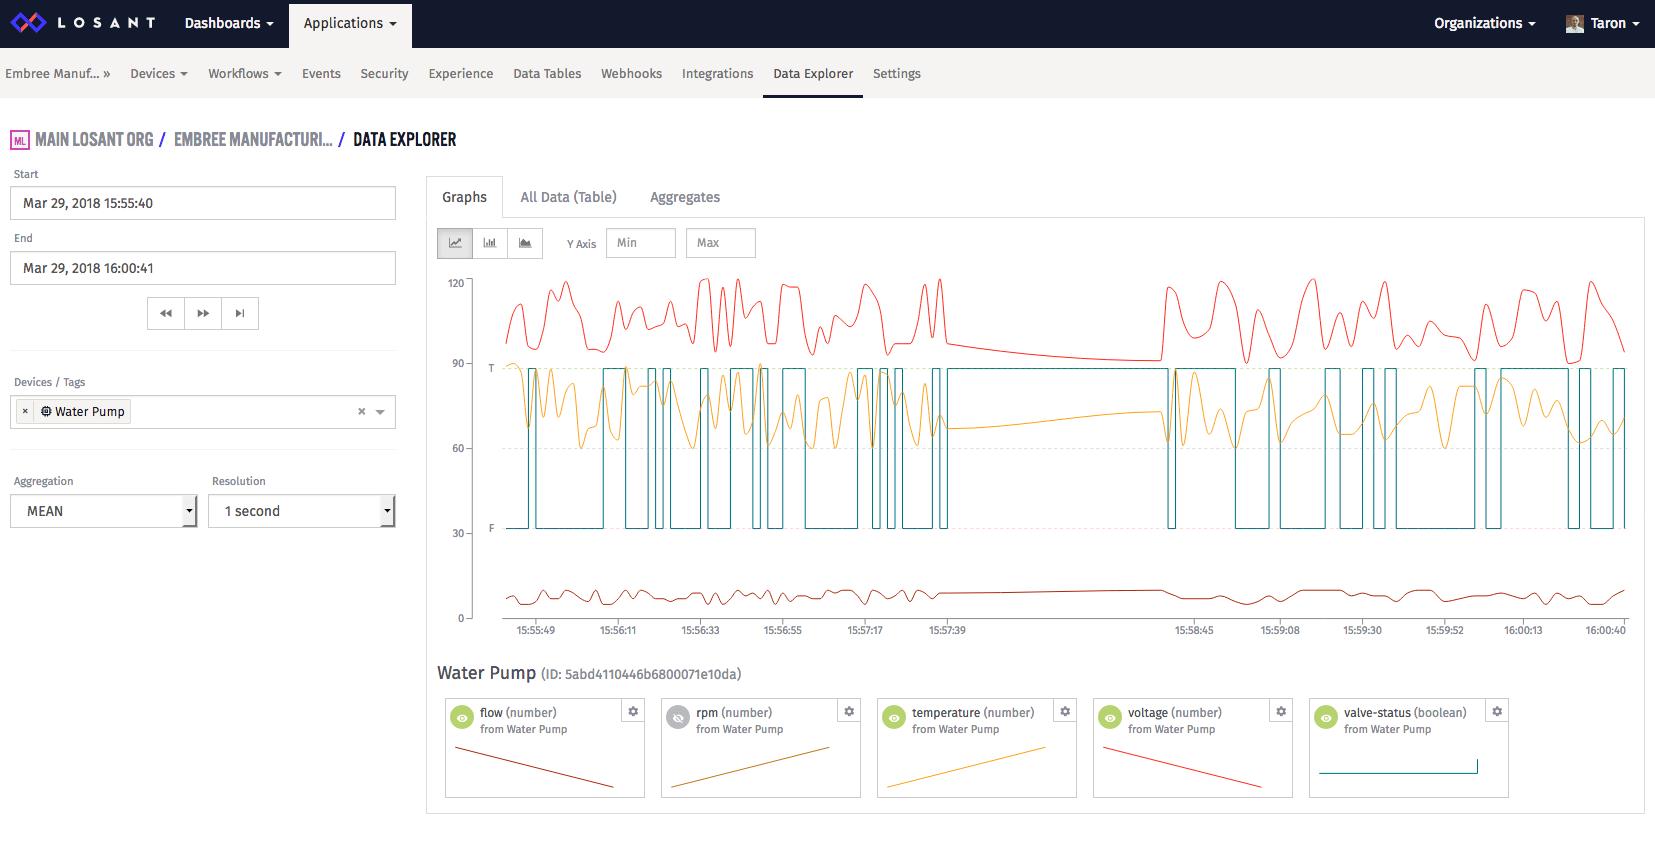
Then, we simulated the data and did a simple analysis using the Data Explorer:
In Course Four, we took a look at different visualizations, reporting, sharing, and all the dashboarding features in Losant. In the workshop, we created a dashboard that supports Context Variables, which allows us to add hundreds and thousands of pumps and each had a distinct dashboard.
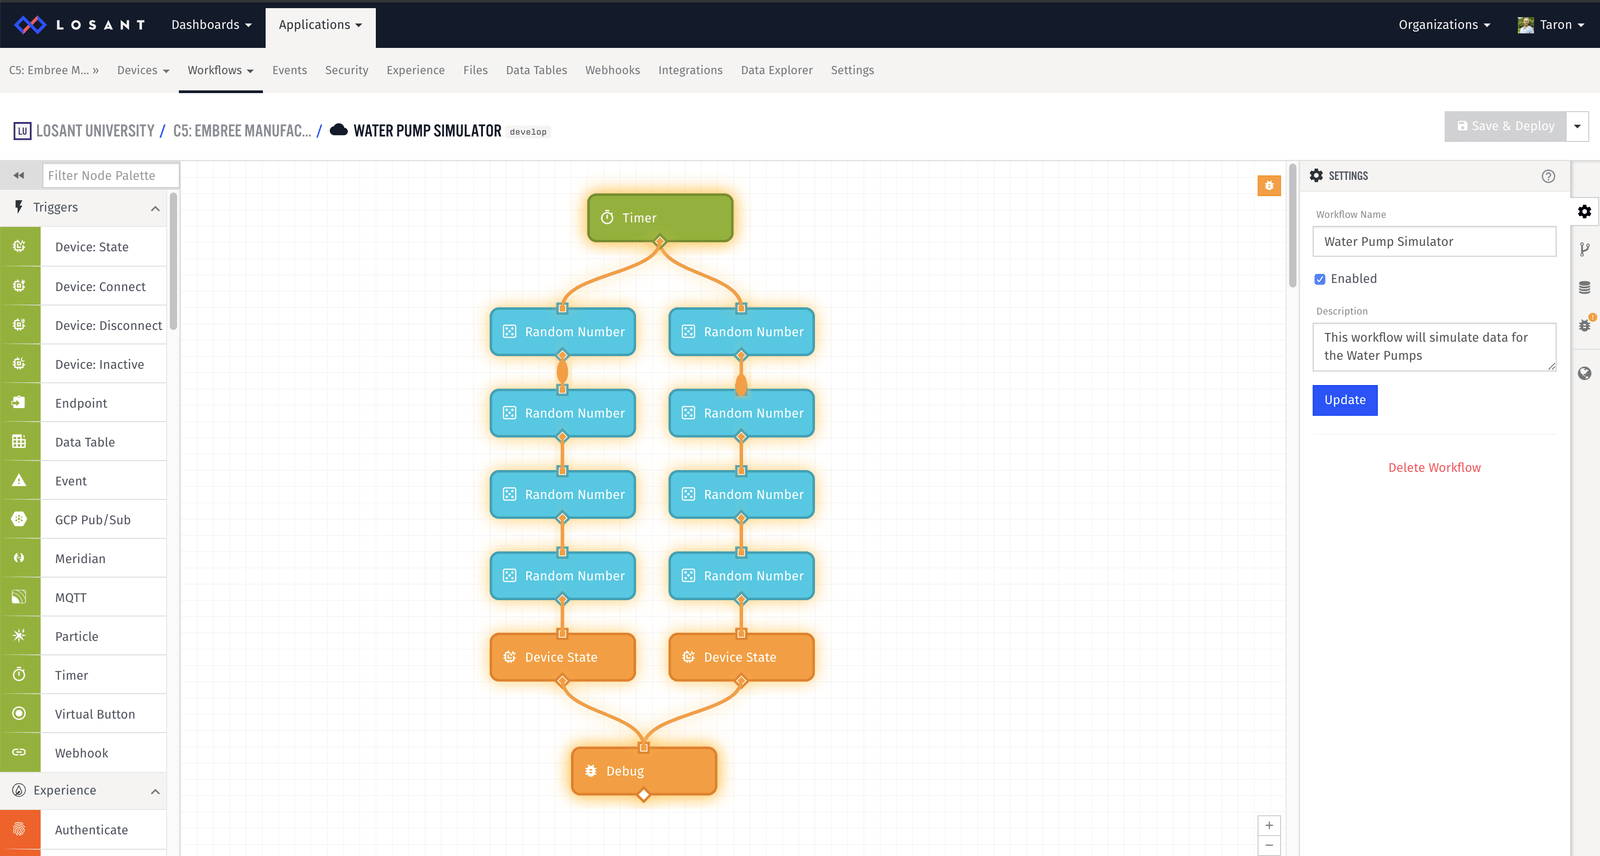
In Course Five, we used the Workflow Engine to simulate data and trigger alerts, and we learned to use the Virtual Button Trigger.
Overview
Now that we’ve covered the Gateway Edge Agent, we can make use of it in this application.
In the real world, our pump could have a PLC that exposes local Modbus TCP. In that case, we could use the Gateway Edge Agent to talk to the pump. However, since we don't have an actual pump with a PLC, we will continue to let the cloud simulate the data and generate other data on the Pi.
To demonstrate the GEA without the need for additional sensors, we are going to read system memory (RAM) and storage (hard drive space) from the Raspberry Pi.
In this workshop we are going to:
- Use the Function Node to read the device memory.
- Use the Run Executable Node to read the device storage.
Let’s begin.
Materials
This workshop assumes that you are using a Raspberry Pi as your edge device.
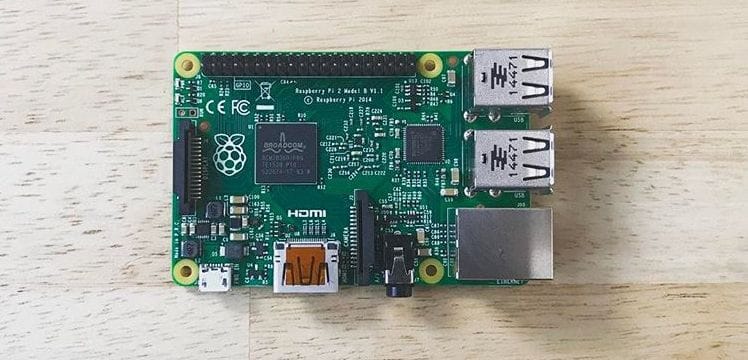
If you don't own a Raspberry Pi, remember that the Gateway Edge Agent can be installed on your own computer running MacOS or Windows.
Part One: Installation and Setup
Before we can begin, we need to install the GEA on our Pi. Please refer to the installation documentation: Gateway Edge Agent Installation.
After you have it installed, we need to get it running. Refer to the Gateway Edge Agent Usage for more information.
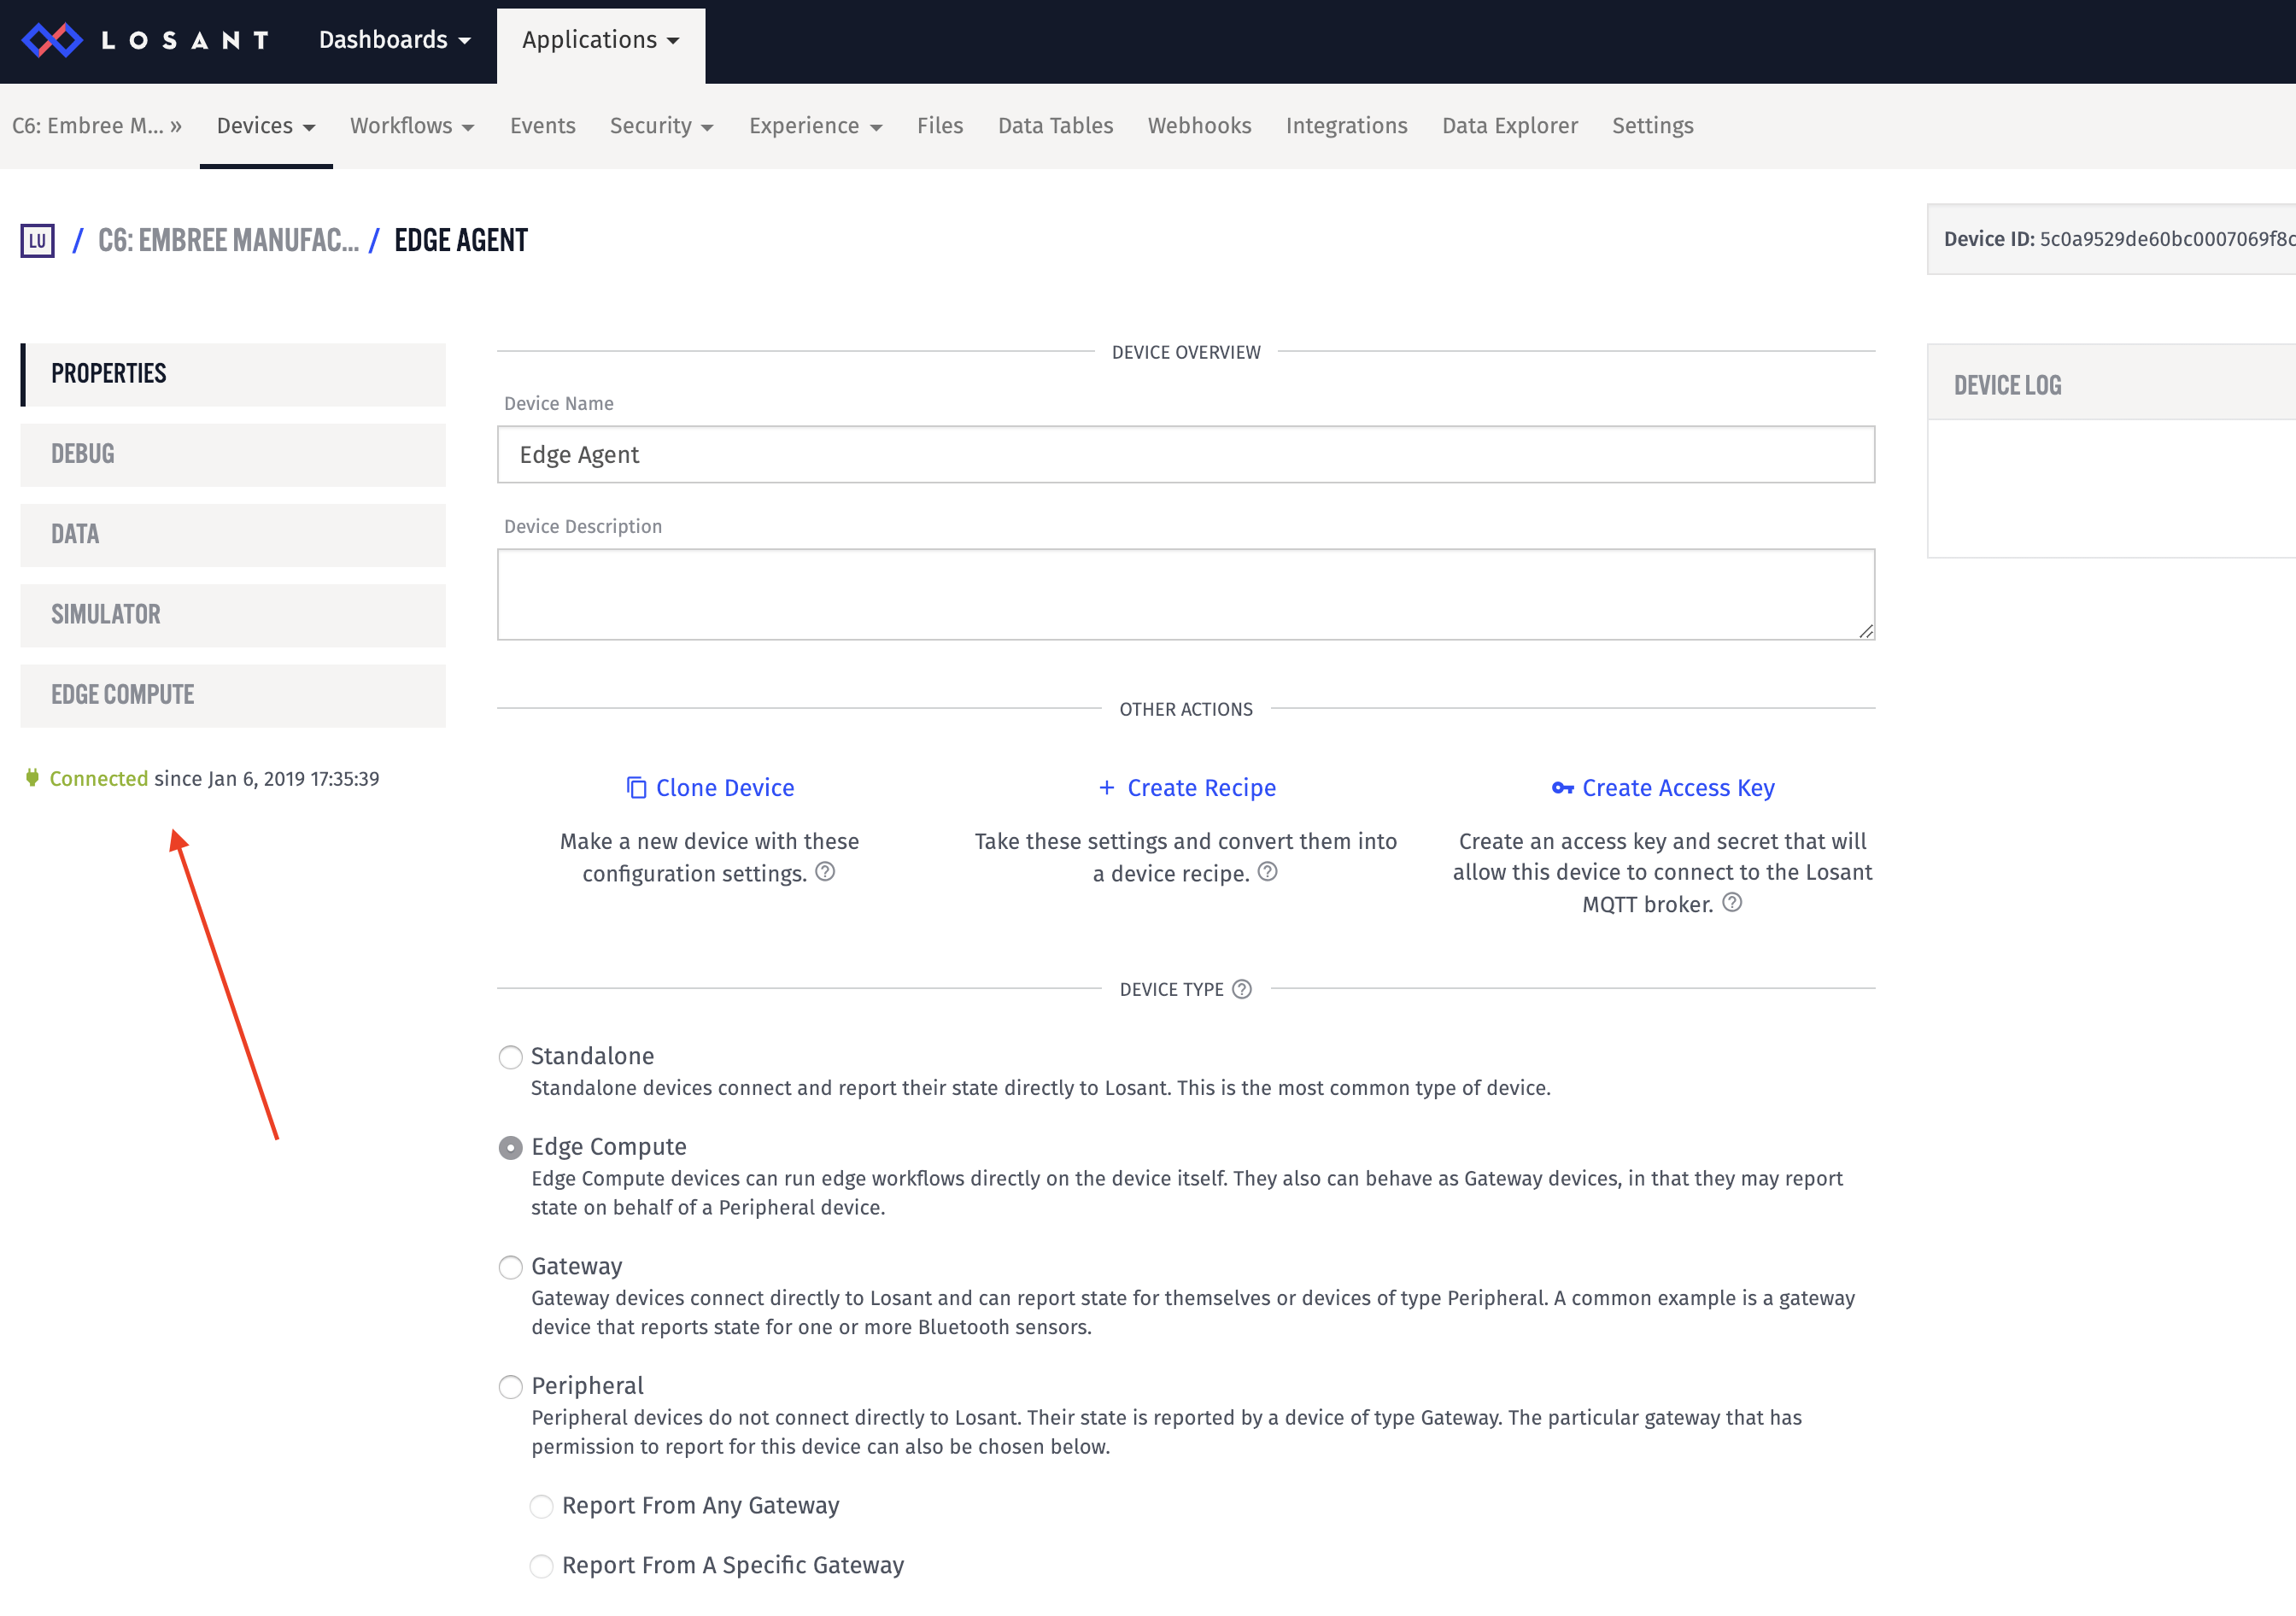
As you are setting up your application, you will be creating a new device. The "Edge Compute" device type in Losant functions like a gateway—meaning it can collect data on behalf of other devices.
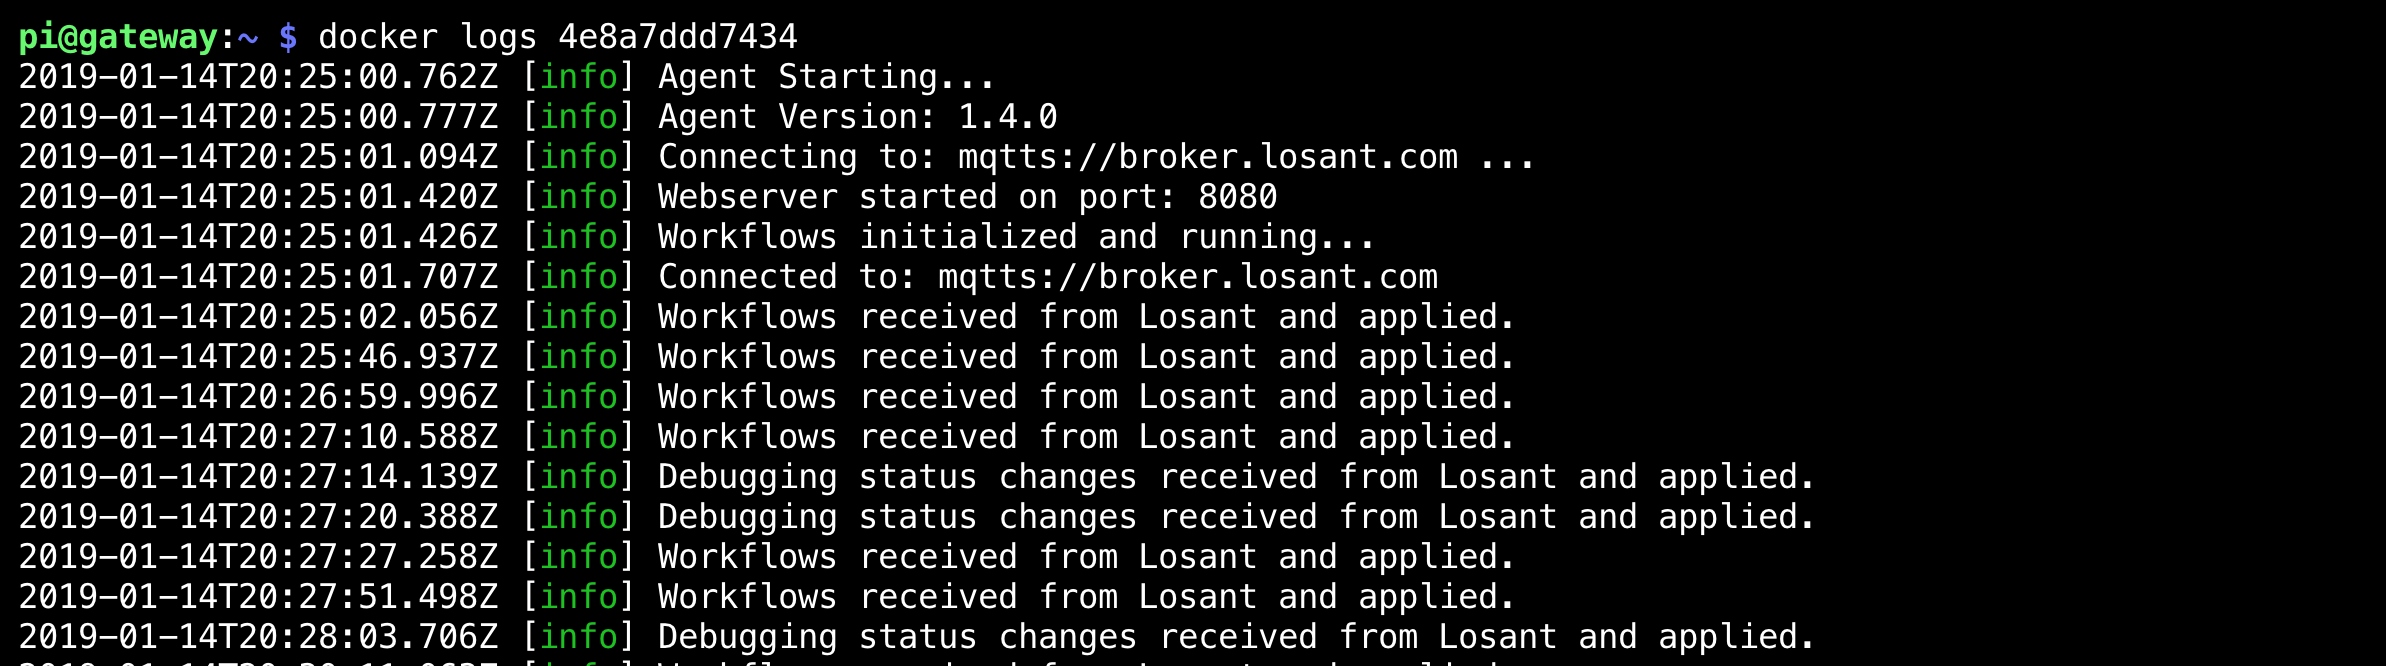
Once done, you should be able to run the docker logs command:
You should also see your device connected within Losant:
Part Two: Reading Memory
We are going to use an Edge Workflow to collect memory information from the Raspberry Pi and save it as device data within Losant. Before we start, we need to add some new attributes to our edge device in Losant:
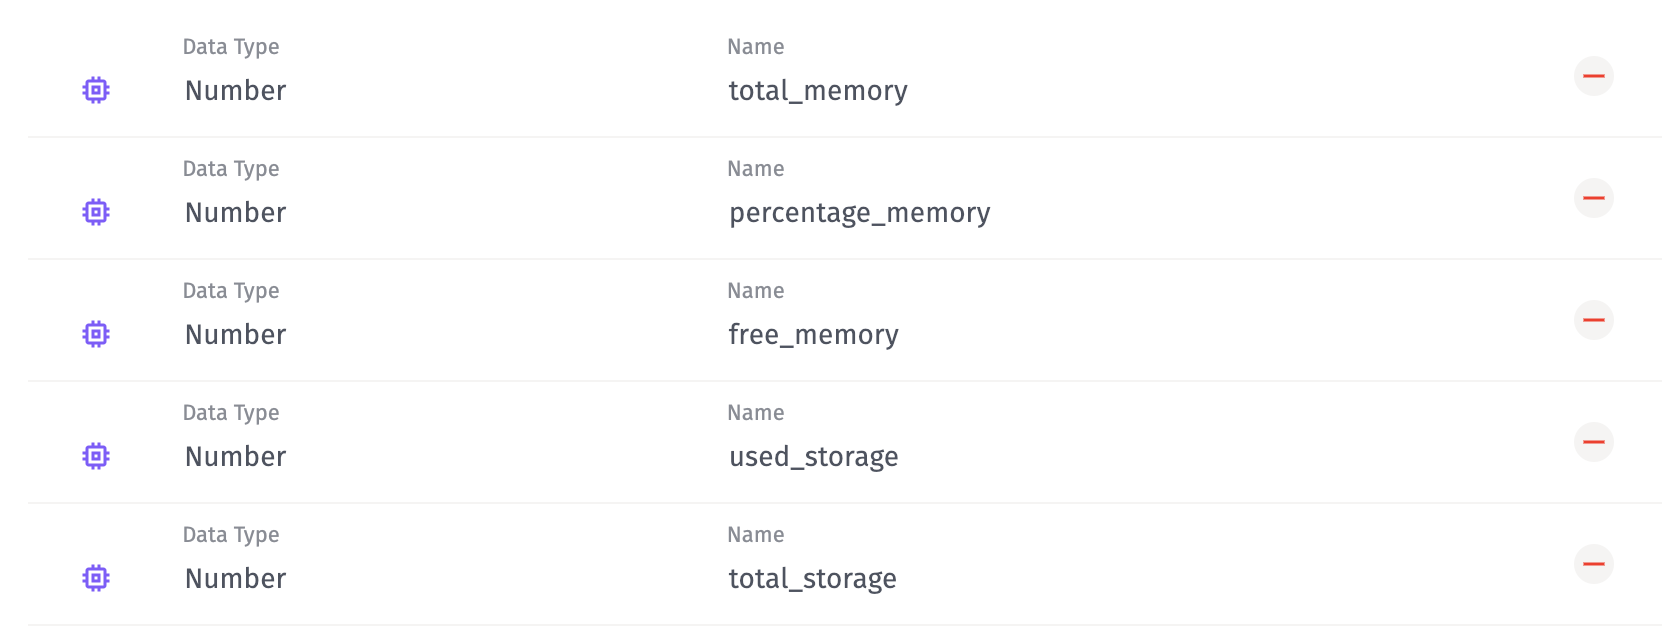
We are going to add the following:
total_memory- Total memory on the edge devicepercentage_memory- Percentage memory used on the edge devicefree_memory- Free memory on the edge deviceused_storage- Amount of storage used on the edge devicetotal_storage- Total amount of storage on the edge device
Next, we need to create a new Edge Workflow:
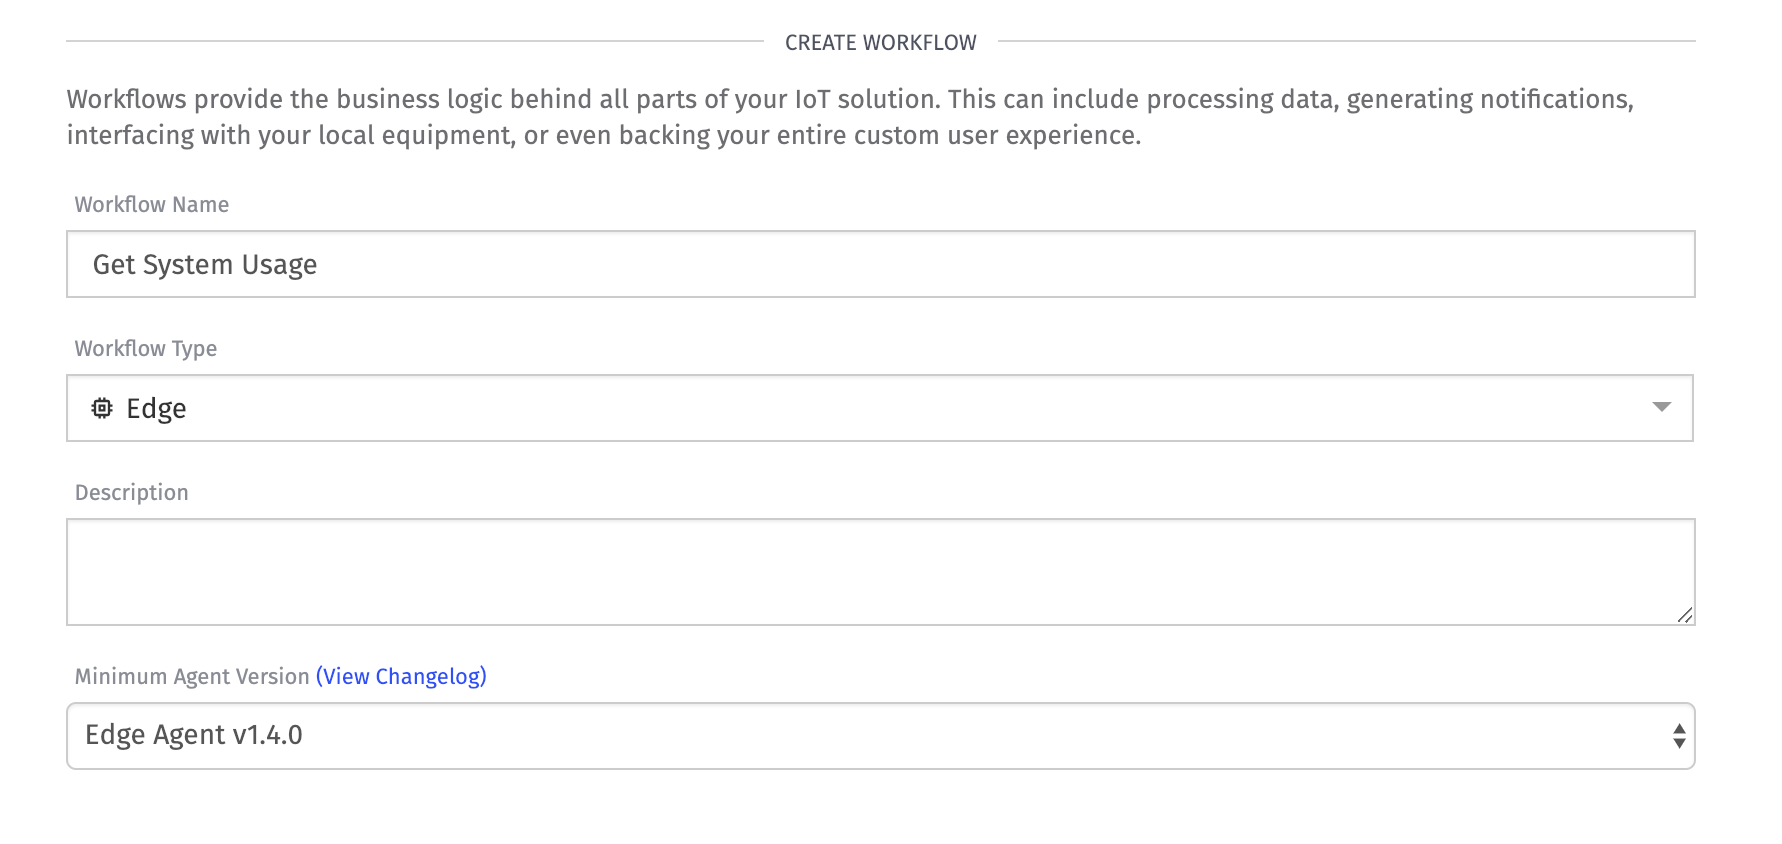
Here is the workflow we are going to build to get system memory:
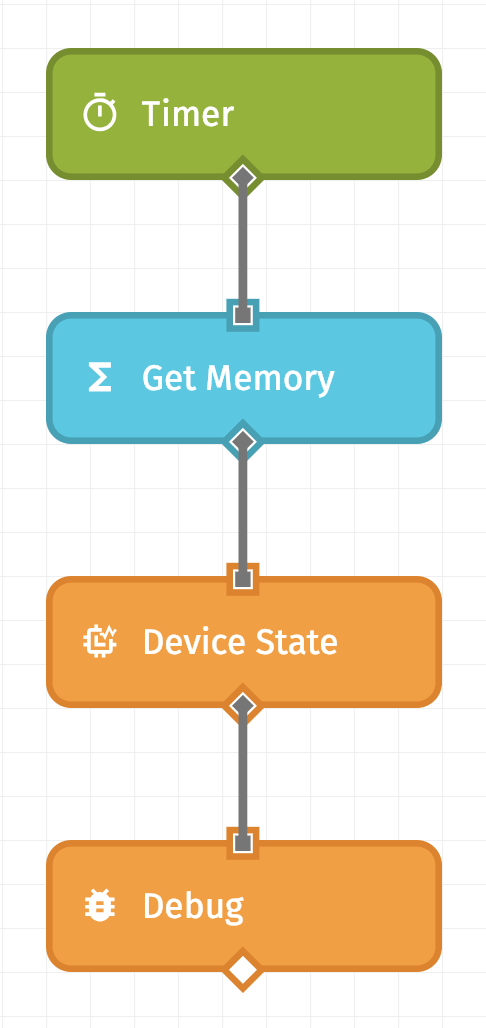
The goal of this workflow is to, on an interval, get system memory information, and report the state to the edge device. To do this we need the following nodes:
- Timer Trigger - to trigger based on an interval.
- Function Node - to get system memory information.
- Device State Node - to report state.
- Debug Node - to inspect the payload.
Since you've used most of these nodes, we won't walk through each one. For this example, let's set the Timer Trigger to run the workflow on an interval of 10 seconds. We will look deeper into the Function Node to see how we are capturing system memory.
Function Node
If you recall, the Edge Function Node is special. Unlike the cloud, it can require Node.js modules. Node.js has a set of built-in modules which you can use without any additional installation. One module, in particular, called os, allows us to access information about the operating system, like memory.
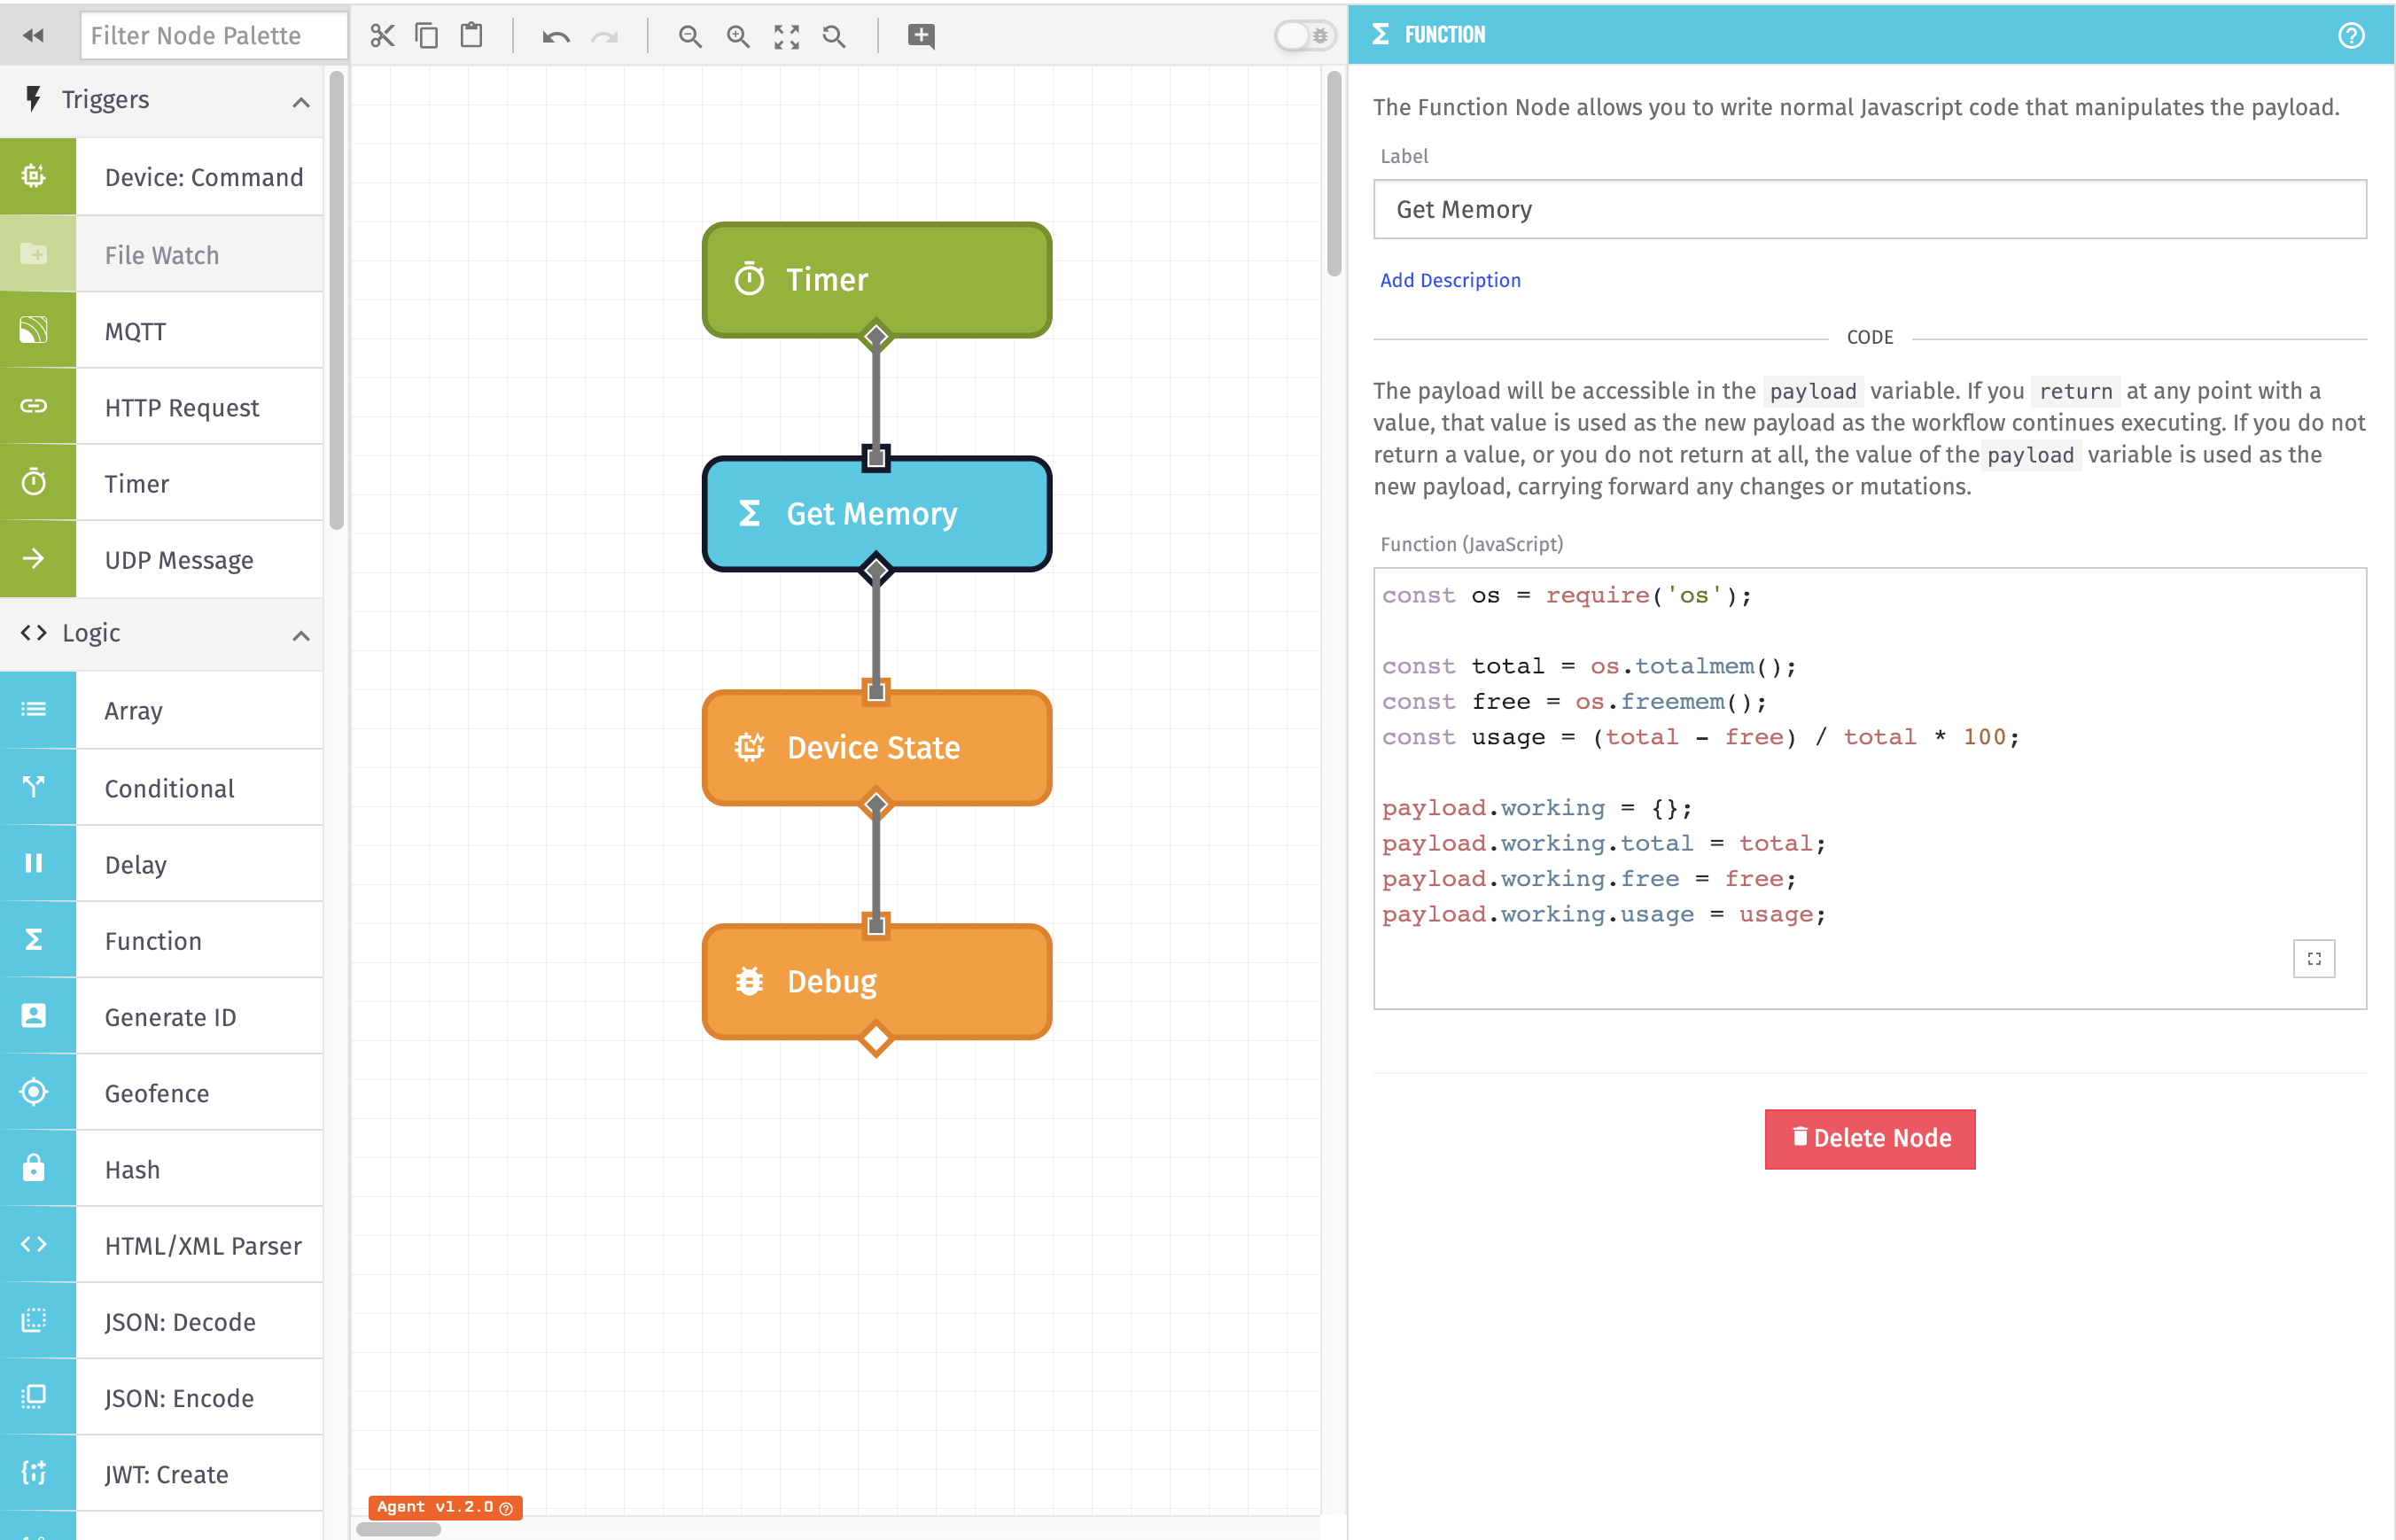
Function Node Configuration:
const os = require('os')

const total = os.totalmem()
const free = os.freemem()
const usage = ((total - free) / total) * 100

payload.working = {}
payload.working.total = total
payload.working.free = free
payload.working.usage = usage
In this JavaScript Code, we are using the os Node.js module to get the total memory, free memory and calculate percentage usage. Then, attach the memory data to the payload on an object called working.
Next, as we did in the last workshop, configure the Device State Node to update these attributes on your device.
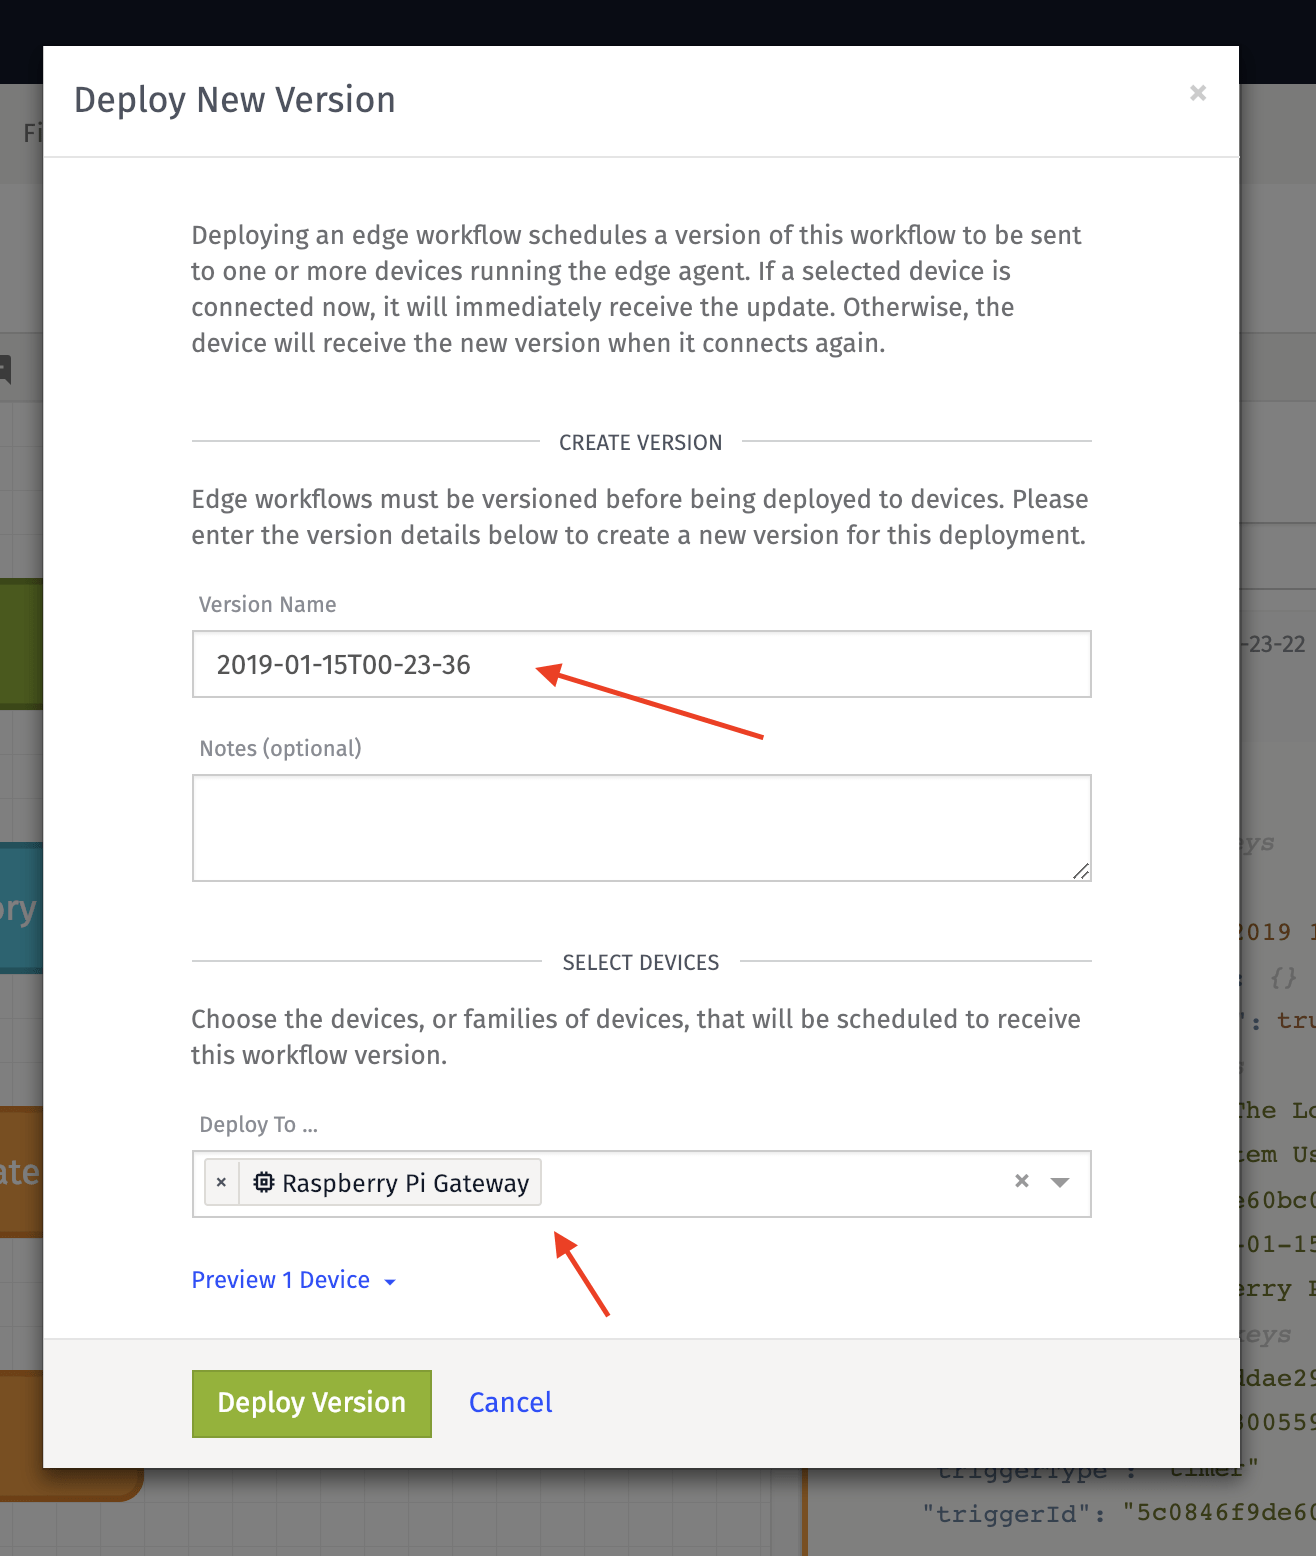
Save and Deploy
After you get done configuring your workflow, click Save and Deploy.
If your device is connected, this will be deployed immediately. You know this by taking a look at the Deployment Tab within the Workflow Engine.
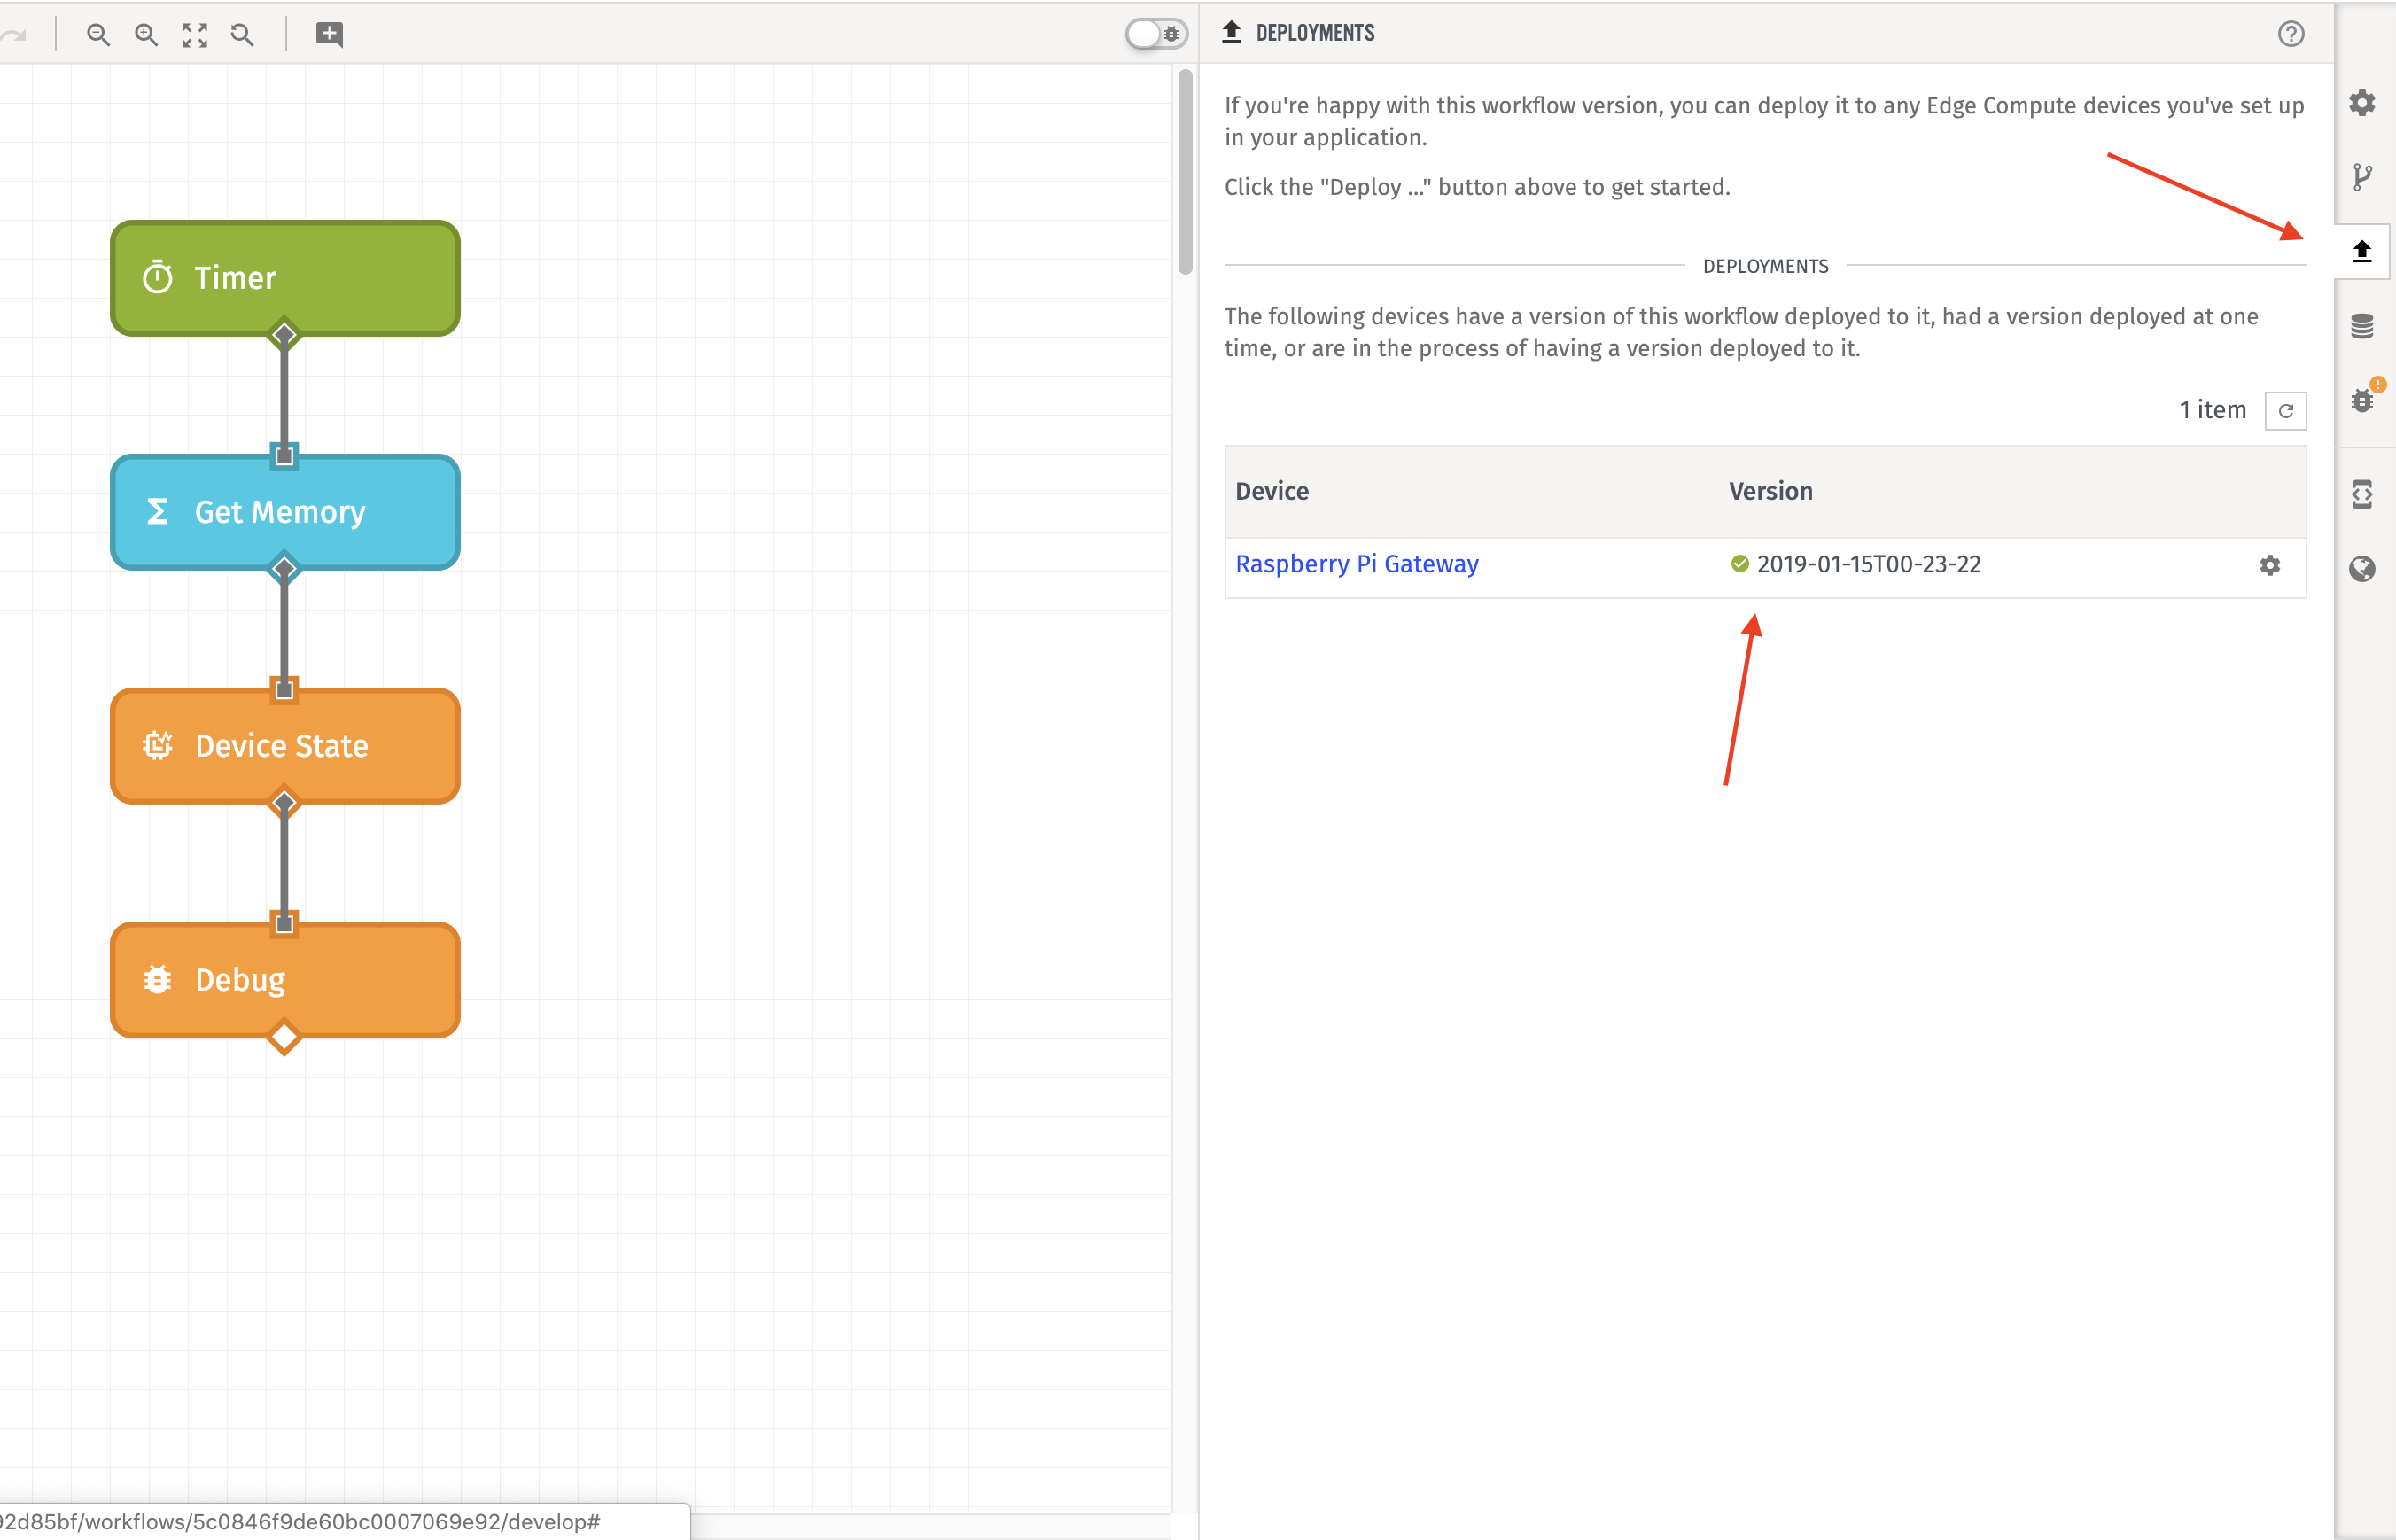
There, you should be able to see your device and the status of your latest deployment. If it didn't deploy, check to see if your device is connected.
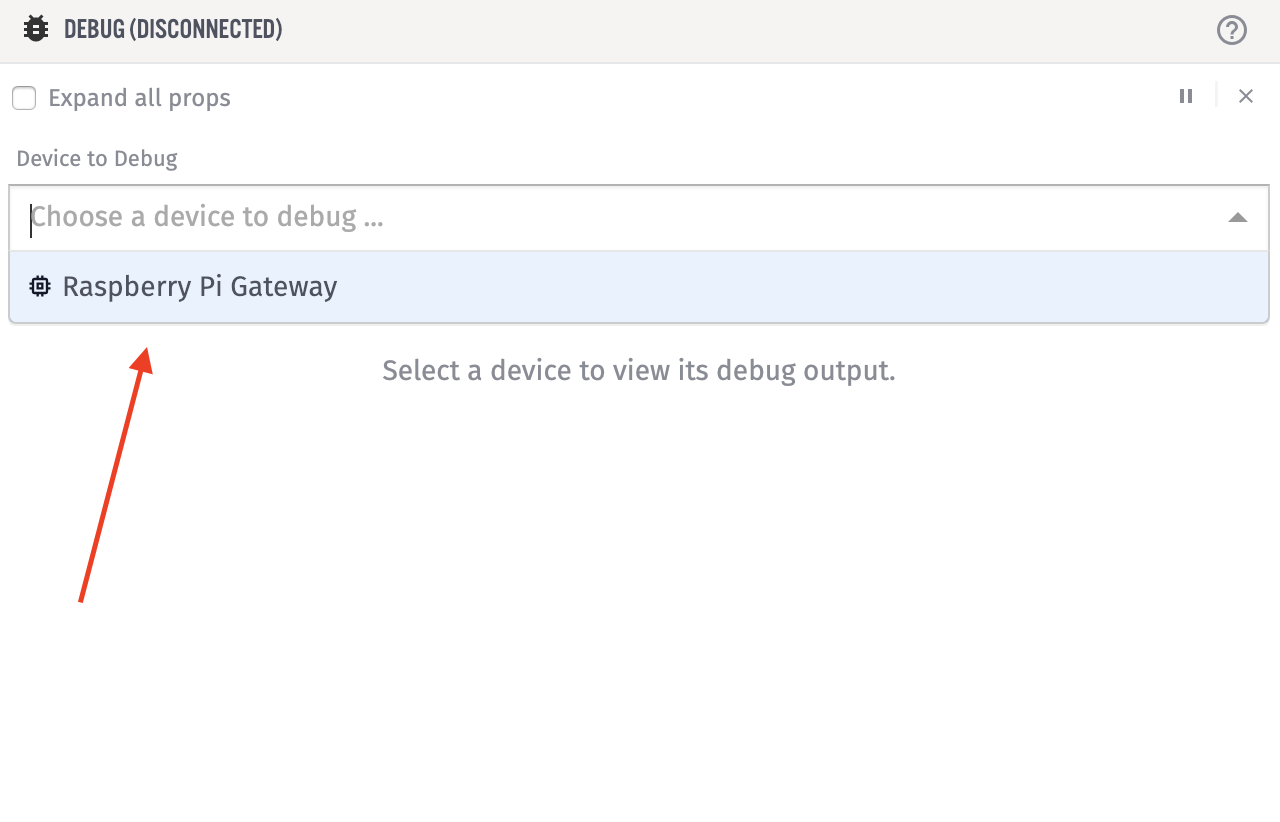
Debug
Once we have confirmed that everything is deployed, since our workflow had a Debug Node, we can look at the payload messages in the Debug Panel. But first, because this is an Edge Workflow, we have to specify which device debug messages we want to look at. This is because this workflow could be deployed to many devices at the same time.
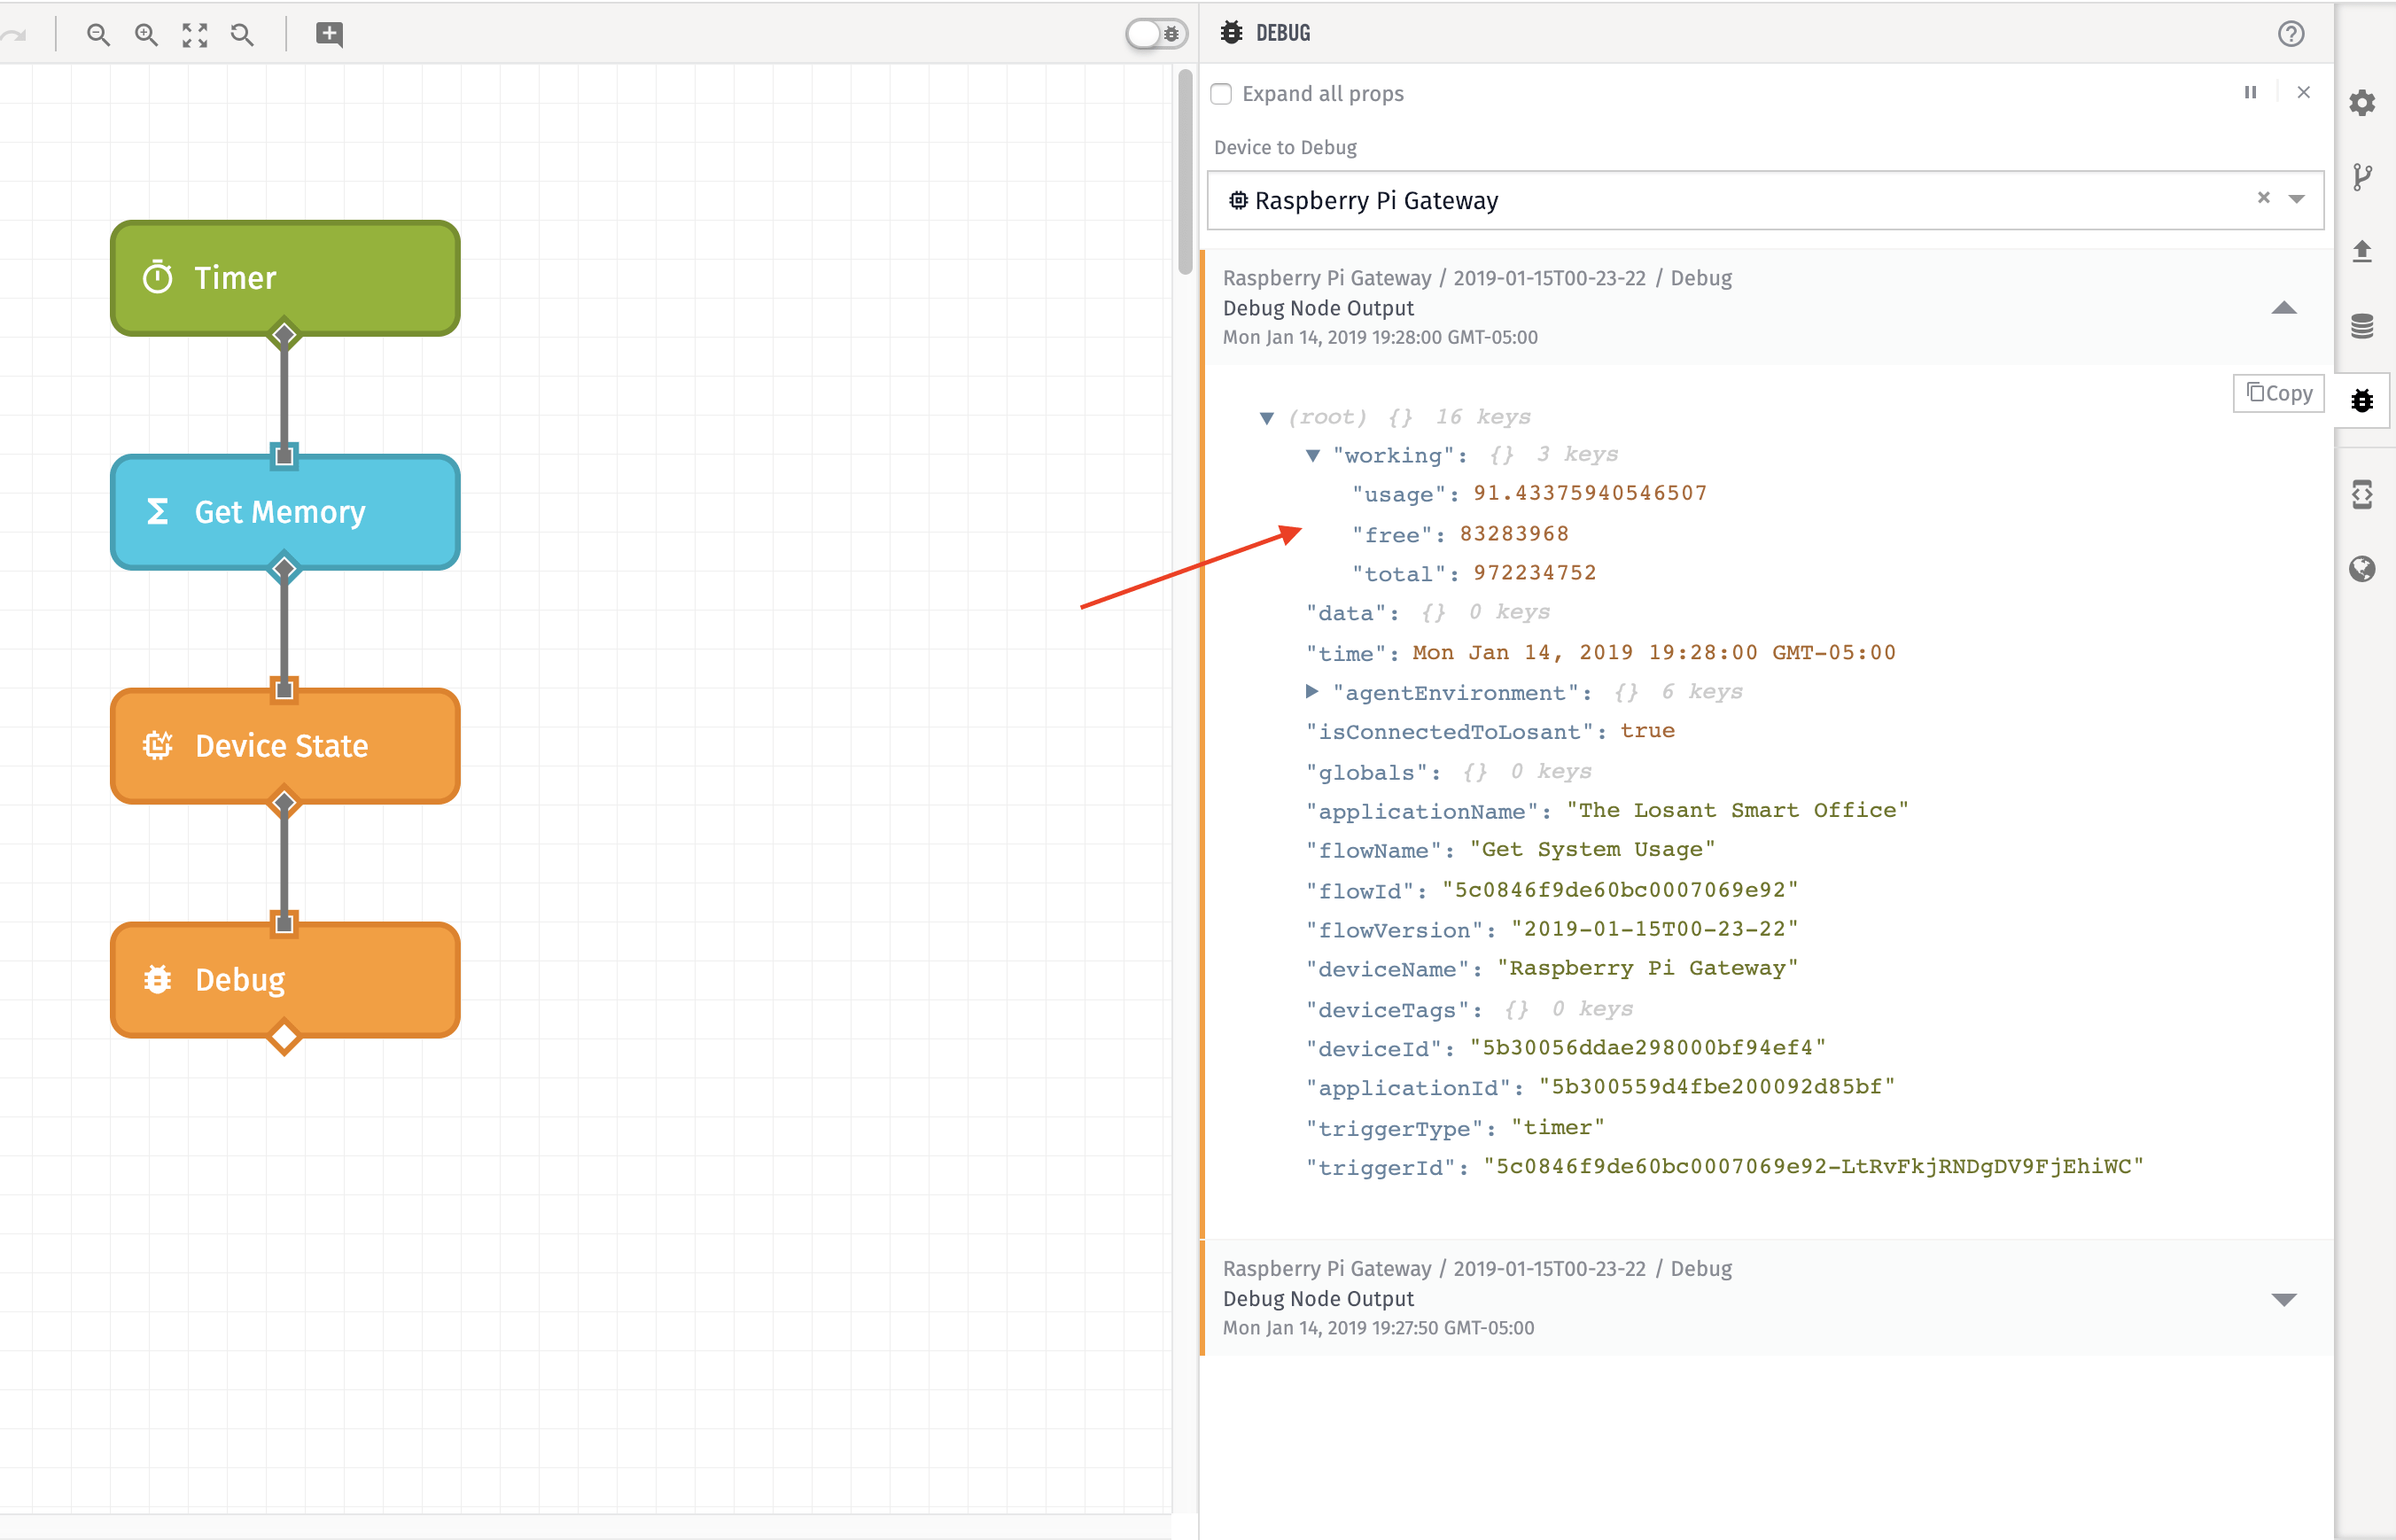
After our device is selected, we should be able to see memory information in the working property on our payload.
When using the Workflow Engine, it's helpful to have standards. Though you can put data anywhere you want on the payload working is a best practice we settled on at Losant. Everything in working represents data that we are actively manipulating a workflow. Using working you can always assume that the rest of the payload is untouched, and you may use those values in other nodes without worry.
Here is what the payload should look like:
To verify that it is indeed saving to a device, you can always check on the Device Debug Page. Next, we need to get system storage. Let’s do that.
Part Three: Get Storage
Now that we have memory, we can grab storage. Yes, we could use the Function Node here as well, but let's accomplish it using another node: the Run Executable Node.
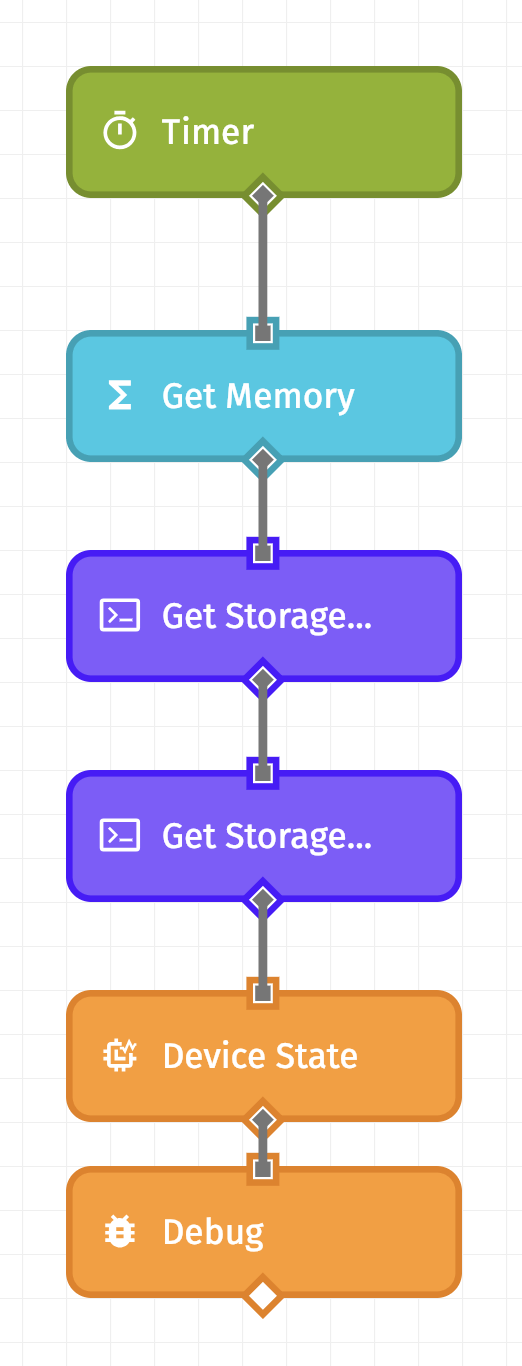
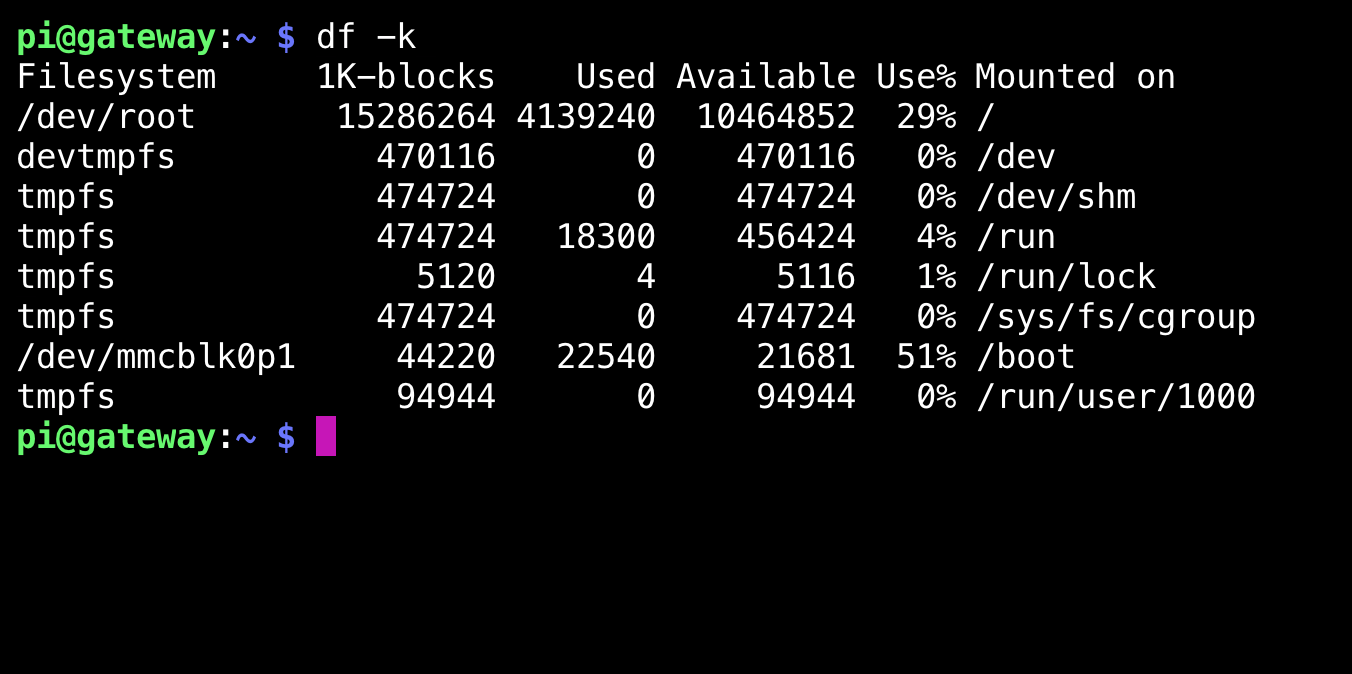
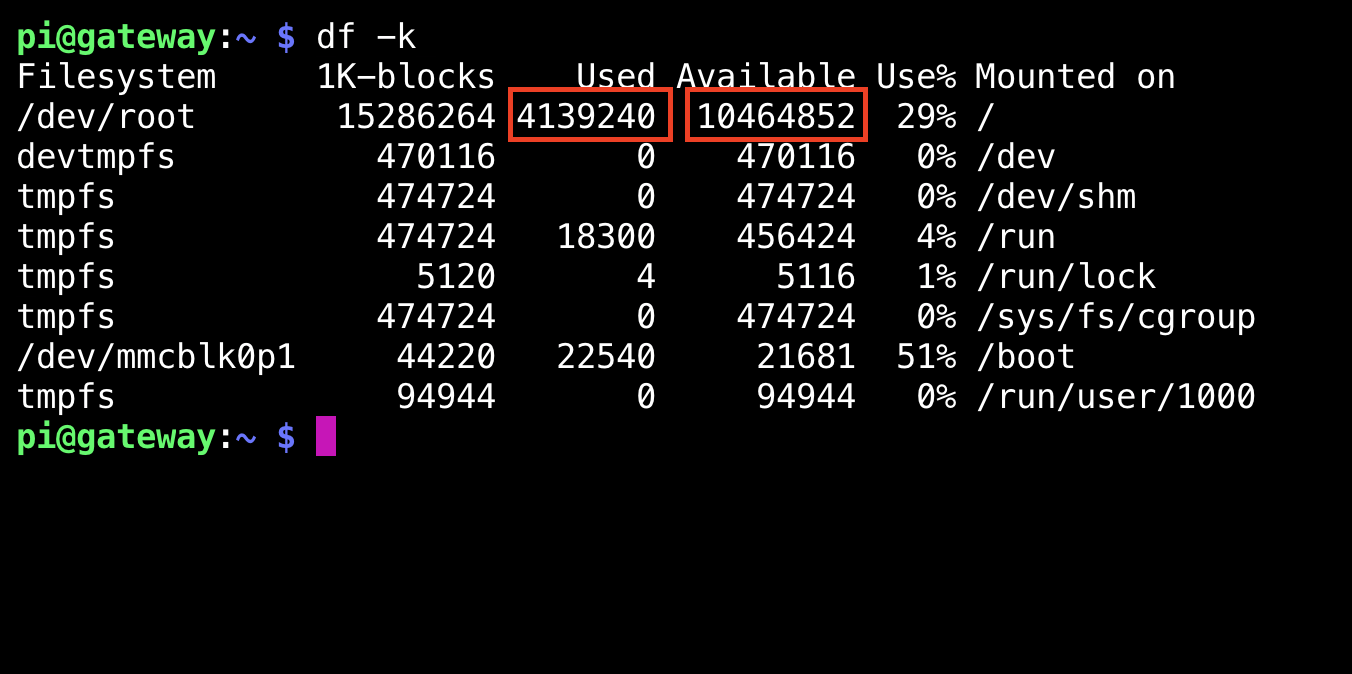
The Run Executable Node allows an edge workflow to run a script or process locally on an Edge Compute device. In other words, it could run the same commands you would run in a terminal. There exists a command called df. It's a quick way to get the file system disk space usage.
Run Executable
Let's use Run Executable Node to run this command, and save that to our device.
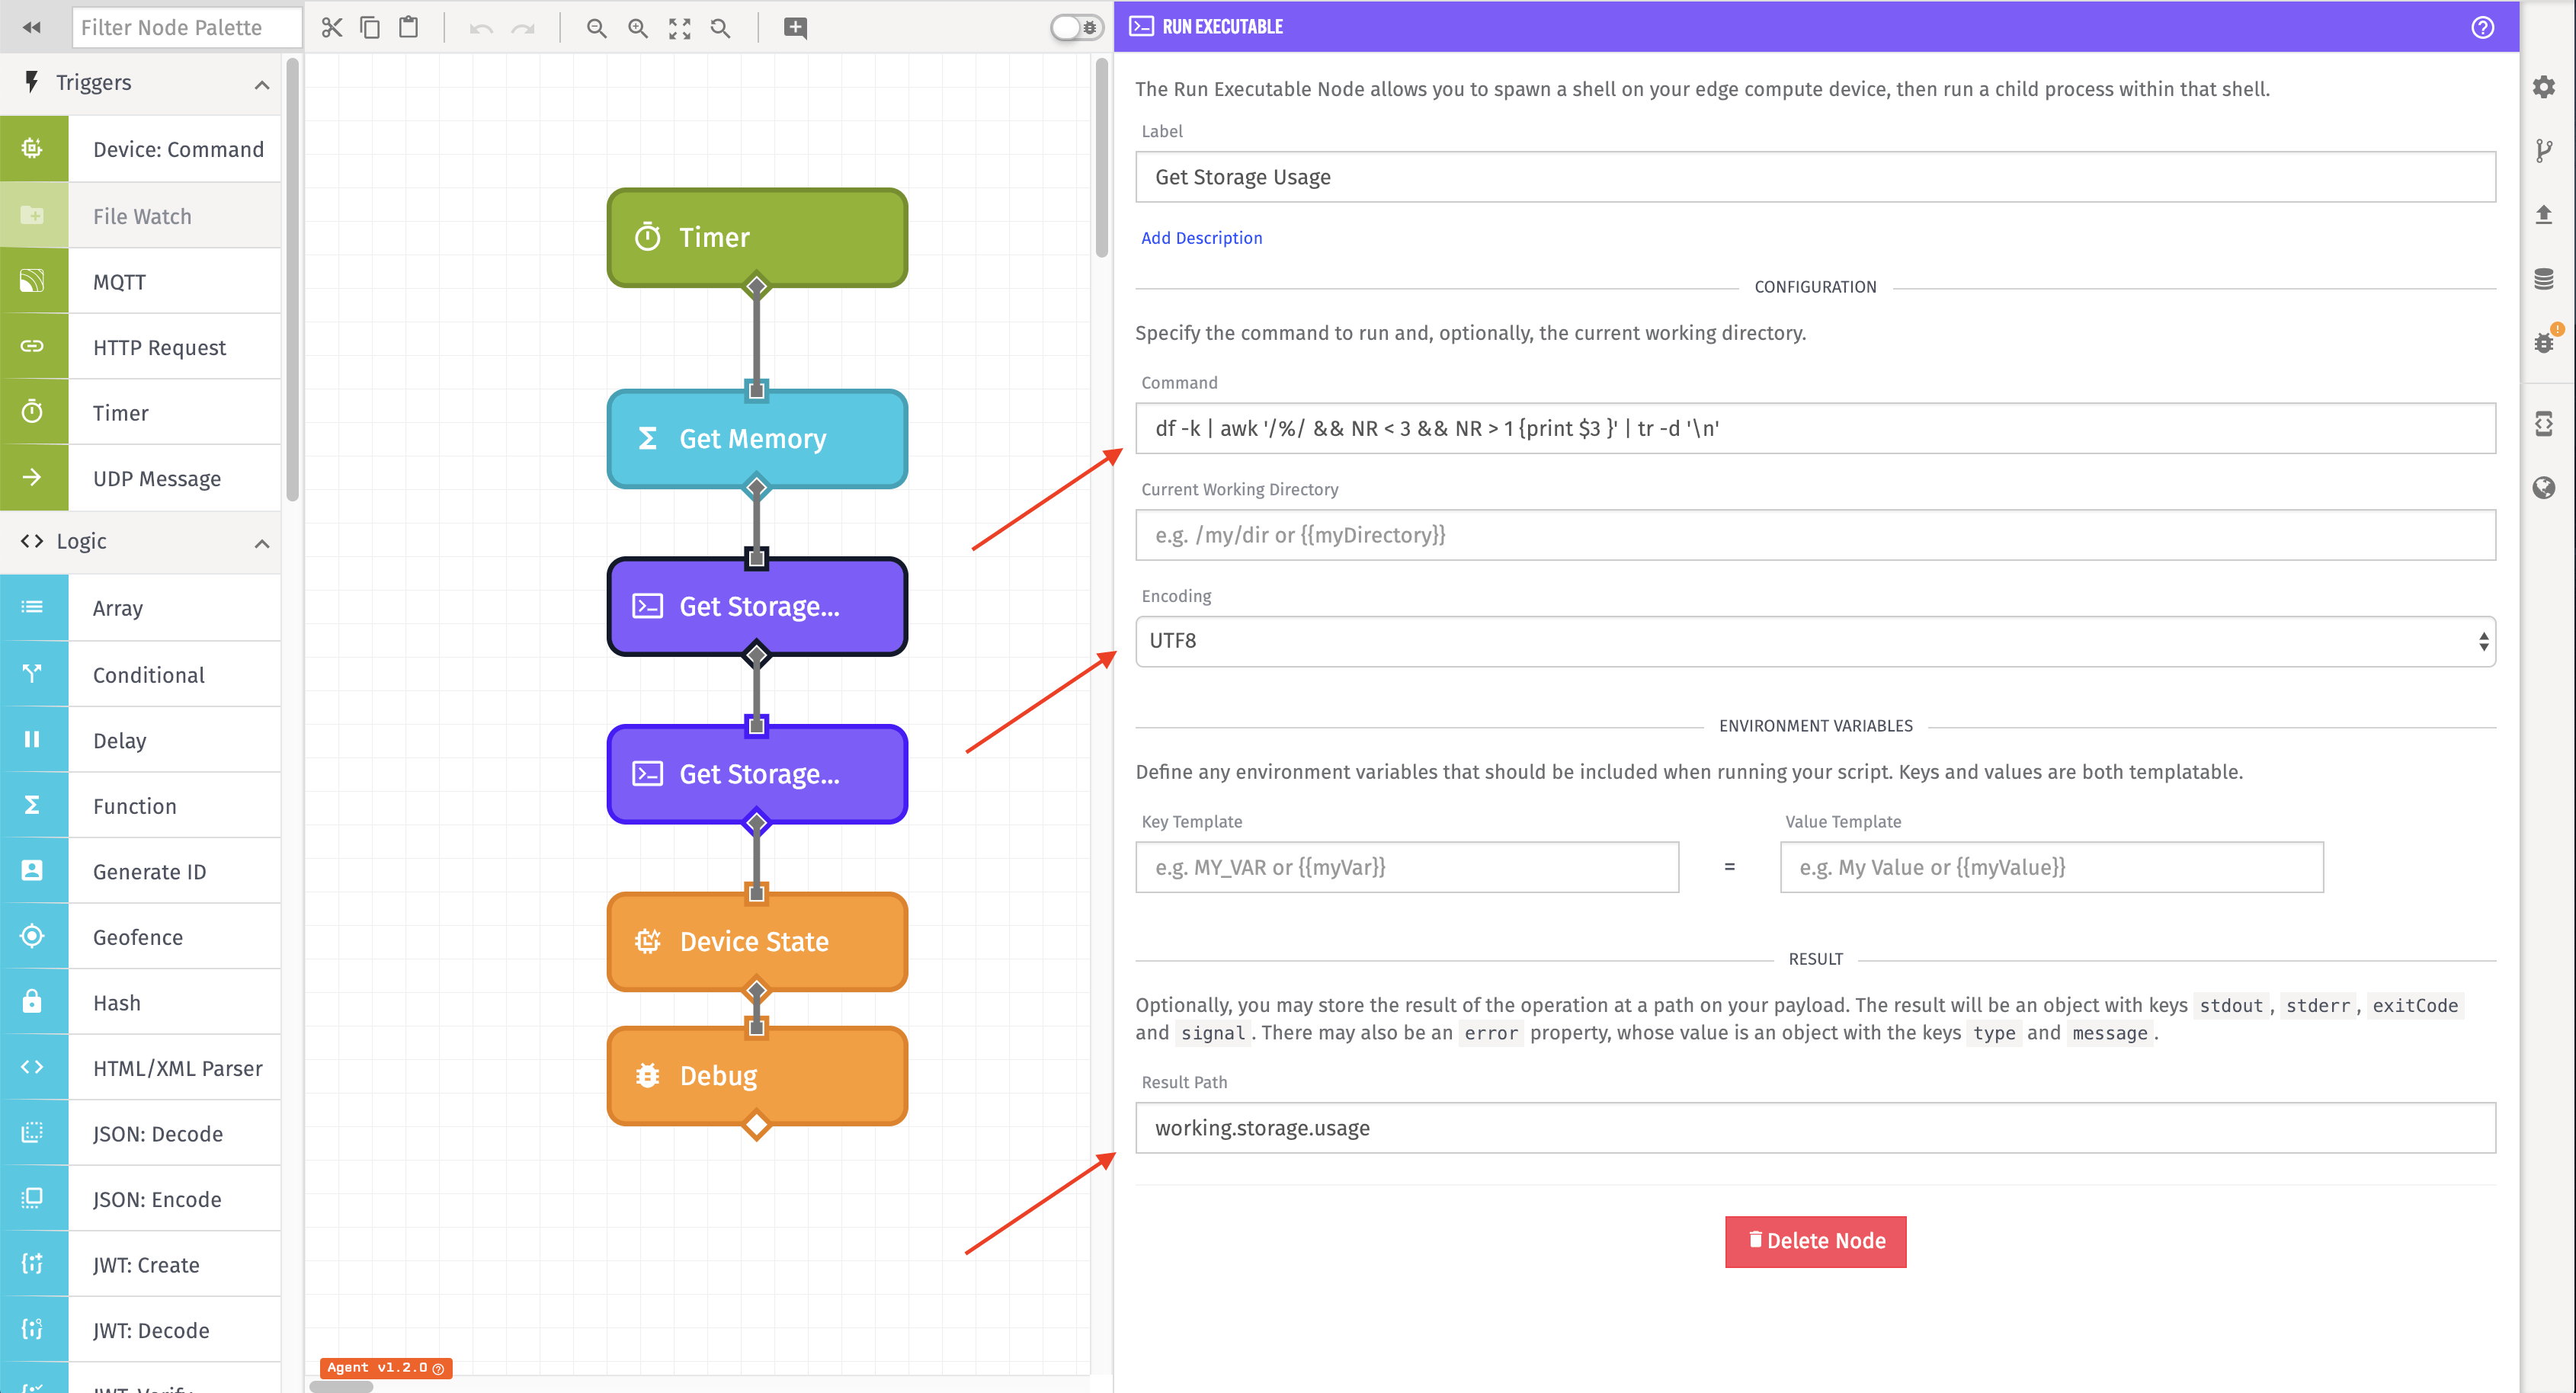
We will need use two Run Executable nodes to do get the storage information we need. From the command we saw earlier, we only care about two values in the first line. The first line represents /dev/root which is the primary drive on the Pi. Then, from that first line, we need to grab the amount of storage used and the total amount available. We can create two commands to only grab those values.
For each node, we will need to configure three settings. For the first:
- Command:
df -k | awk '/%/ && NR < 3 && NR > 1 {print $3 }' | tr -d '\n'
- Encoding: UTF-8
- Result Path:
working.storage.usage
For the second:
- Command:
df -k | awk '/%/ && NR < 3 && NR > 1 {print $4 }' | tr -d '\n'
- Encoding: UTF-8
- Result Path:
working.storage.total
Lastly, update the Device State Node to update these attributes on your device.
What's Next?
Edge Workflows are very valuable for specific types of IoT applications. The best thing you can do for additional practice is to connect the Gateway Edge Agent to devices you already own and build Edge Workflows.
All Done
Congratulations, you are now officially done with Course Six of Losant University! If you run into any troubles along the way, the Documentation and Forums are there to help.
Was this page helpful?
Still looking for help? You can also search the Losant Forums or submit your question there.