Usage
Organizations are subject to limits on their monthly payload consumption, notebook minute usage, and the number of resources (e.g. devices, applications, and more) that are registered under them. Organizations may request increases to individual resource limits, though any such request may come at an additional cost.
Viewing Current Usage
Organization administrators may view detailed payload, notebook minute, and resource usage statistics aggregated across the whole organization by clicking the "Usage" subnavigation item.
Payloads
The "Payloads" tab displays detailed information about your organization's payload count usage across different time ranges - by choosing a Comparison Type of separate billing periods (months), or by comparing individual days.
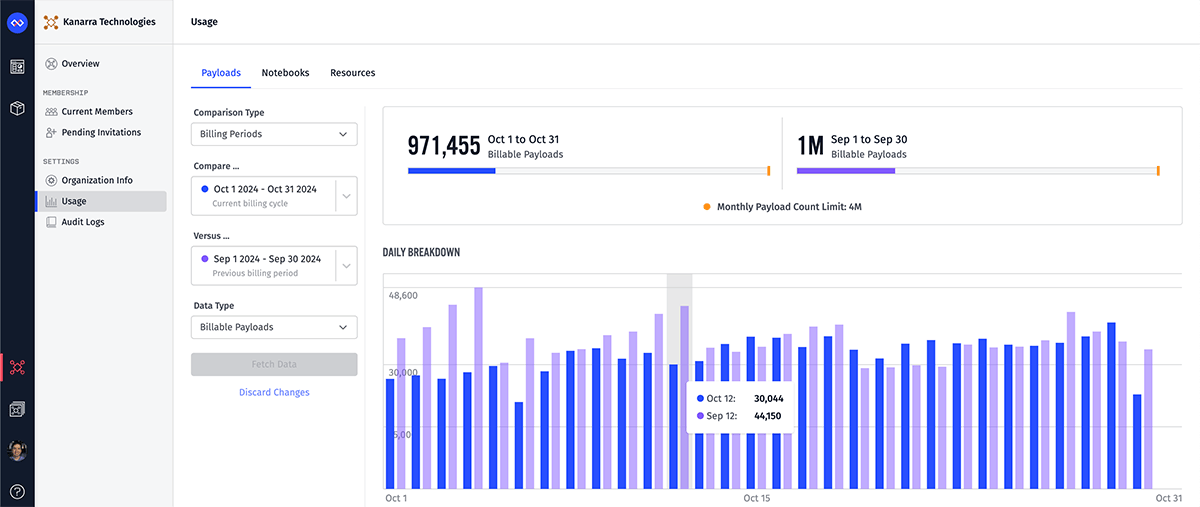
The Billing Periods comparison method allows you to compare payload usage for different billing cycles. Available options are the current billing cycle, the previous billing cycle, or two billing cycles ago.
If you wish to investigate your payload usage on a specific day and see per-hour usage, select Daily as your Comparison Type. There you can choose any day within the last 93 days. Each hour represents UTC time.
There are three different Data Types available:
- Billable payloads count (default)
- All payloads count (includes billable and non-billable payloads)
- All payloads as bytes moving through the system
At the top of the tab, you will see total payload usage for the selected type and usage periods relative to the organization's payload limit (if viewing a Billing Periods comparison).
The breakdown graph displays daily or hourly payload usage within selected time period. When selecting a Daily comparison, the hourly payload usage is reflected in the UTC timezone.
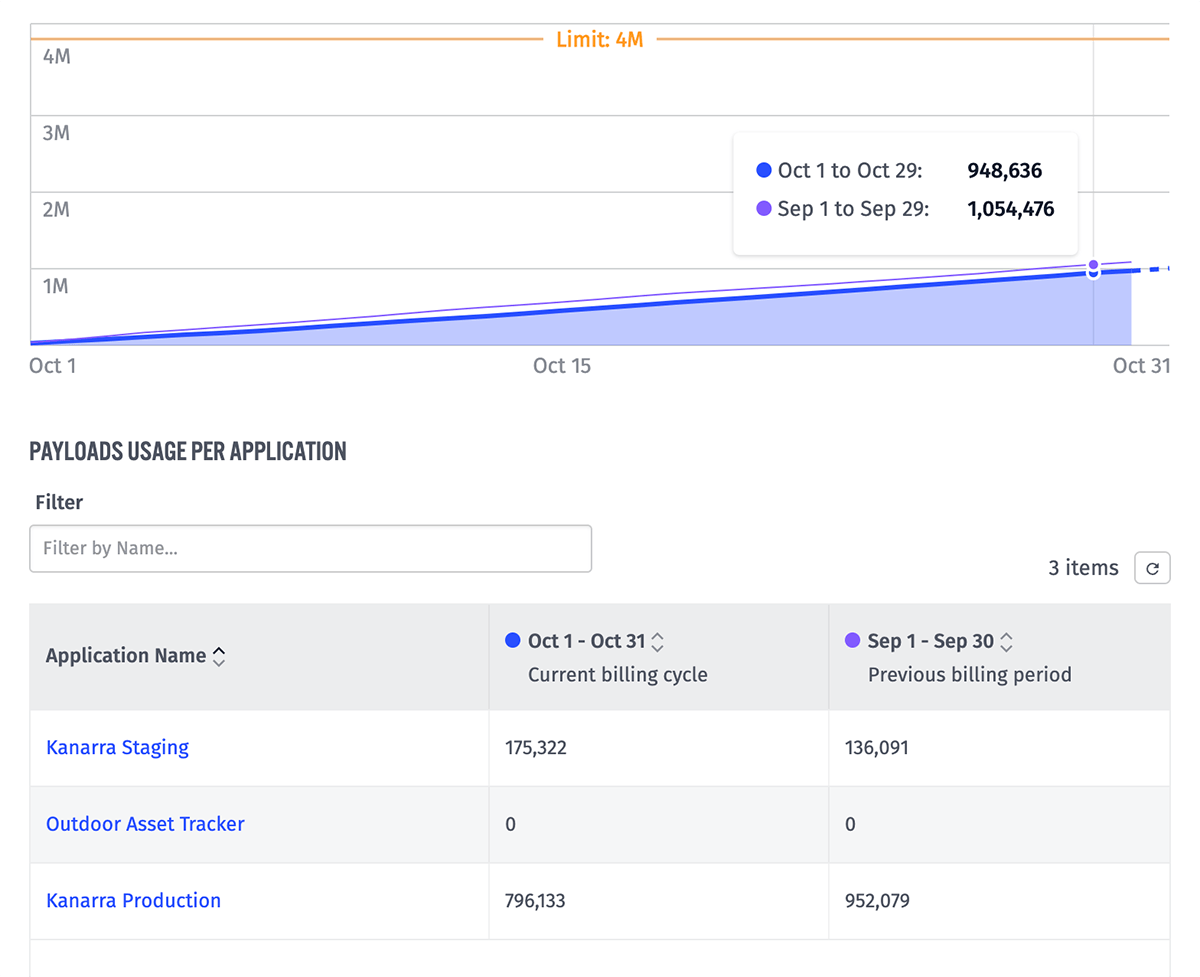
The bottom graph displays cumulative payload usage for the selected period, along with projected cumulative usage for future dates if an in-progress billing period is selected. The graph also displays the monthly payload limit as a reference line when viewing a Billing Periods comparison.
Beneath the graph is a table displaying the organization's applications and each application's usage for the two selected billing periods.
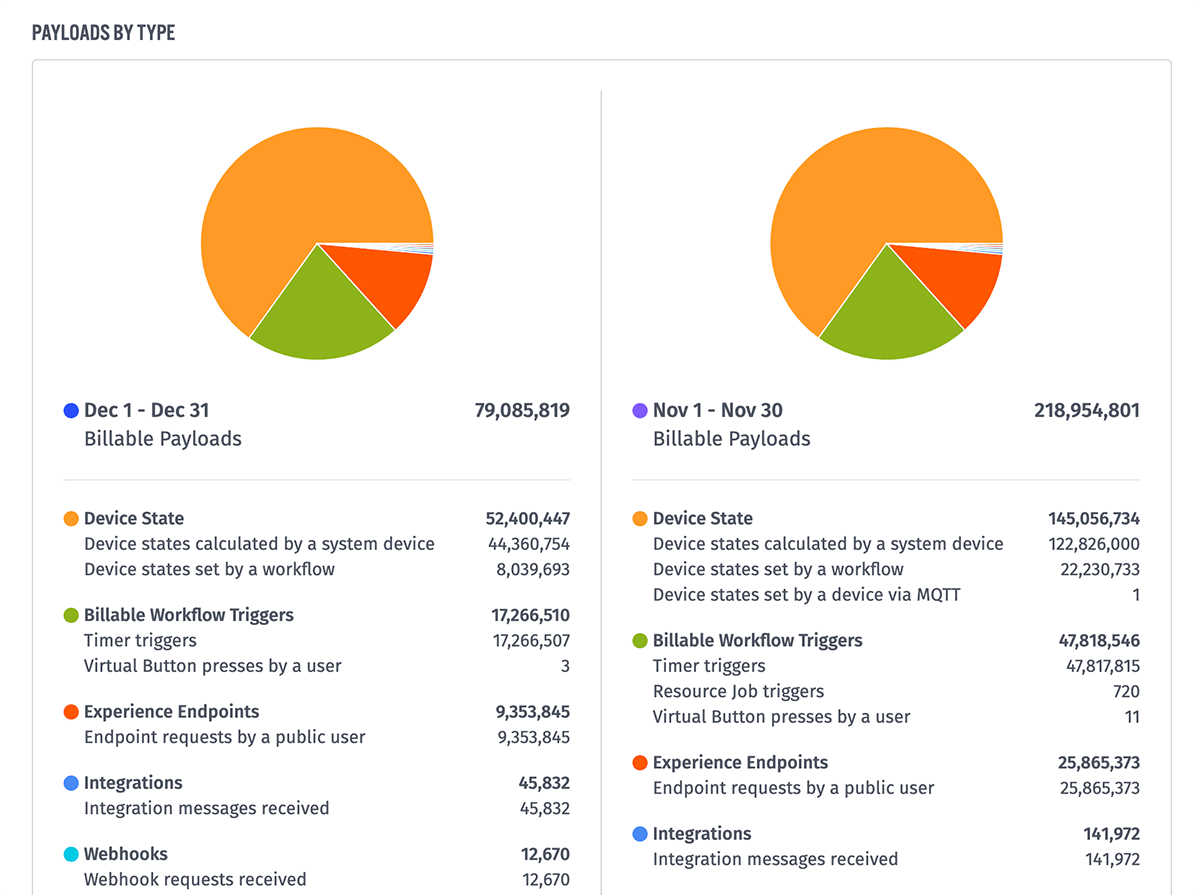
Finally, beneath the applications table is a breakdown of payload usage by type for the chosen Comparison Type and Data Type. This details the kinds of payloads from the summary numbers for the selected time ranges and their share of the total as a pie chart, as well as more detailed breakdowns of each type.
Notebooks
The "Notebooks" tab displays detailed information about your organization's notebook minute usage.
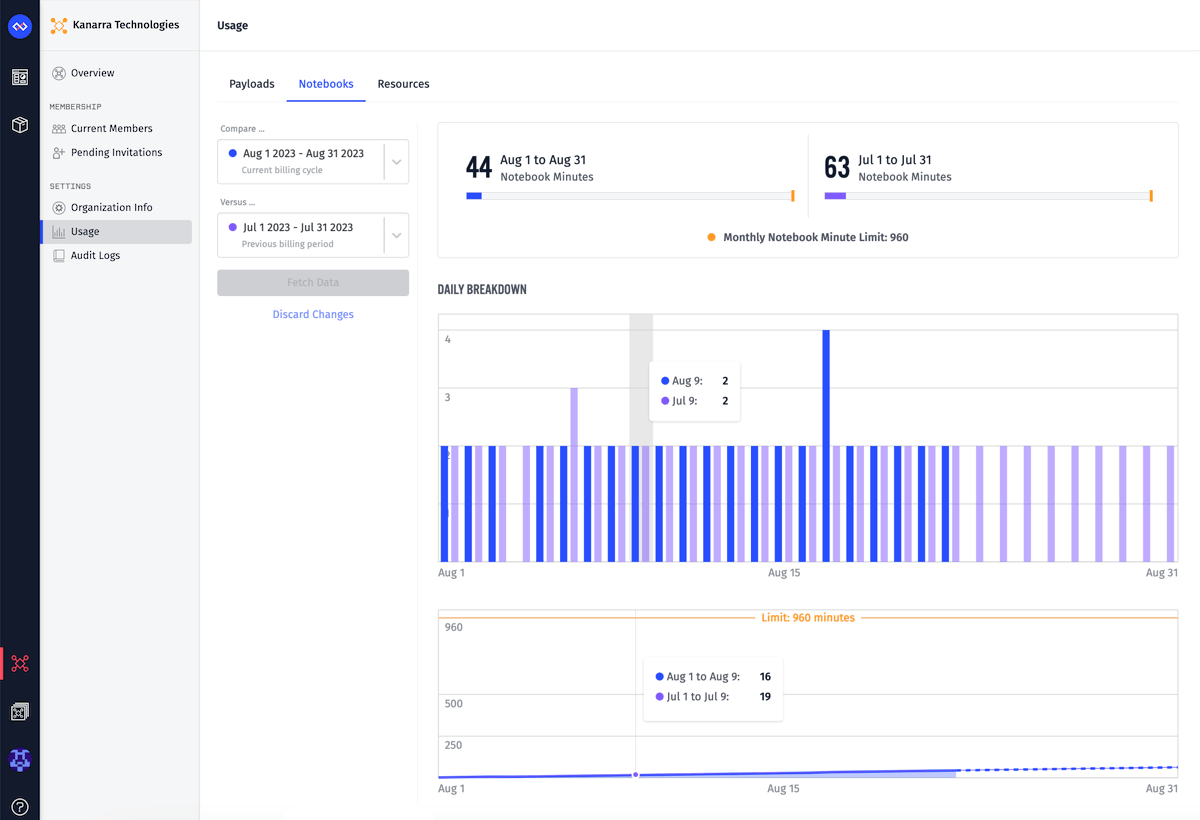
The graphs are similar to what is displayed on the "Payloads" tab: usage summaries relative to the organization's minutes limit, a per-day breakdown, a cumulative graph, and a per-application usage table. However, there are a couple differences ...
- Notebook usage can only be viewed across billing periods, not on a per-day basis. This means there is no hourly breakdown of minute usage available.
- There are no "Data Types" to consider other than minute usage.
- There is no pie chart breaking down the summary by types, as notebook minute usage does not break down into subcategories.
Resources
On the "Resources" tab you will find comprehensive information about your organization's resource usage and limits.
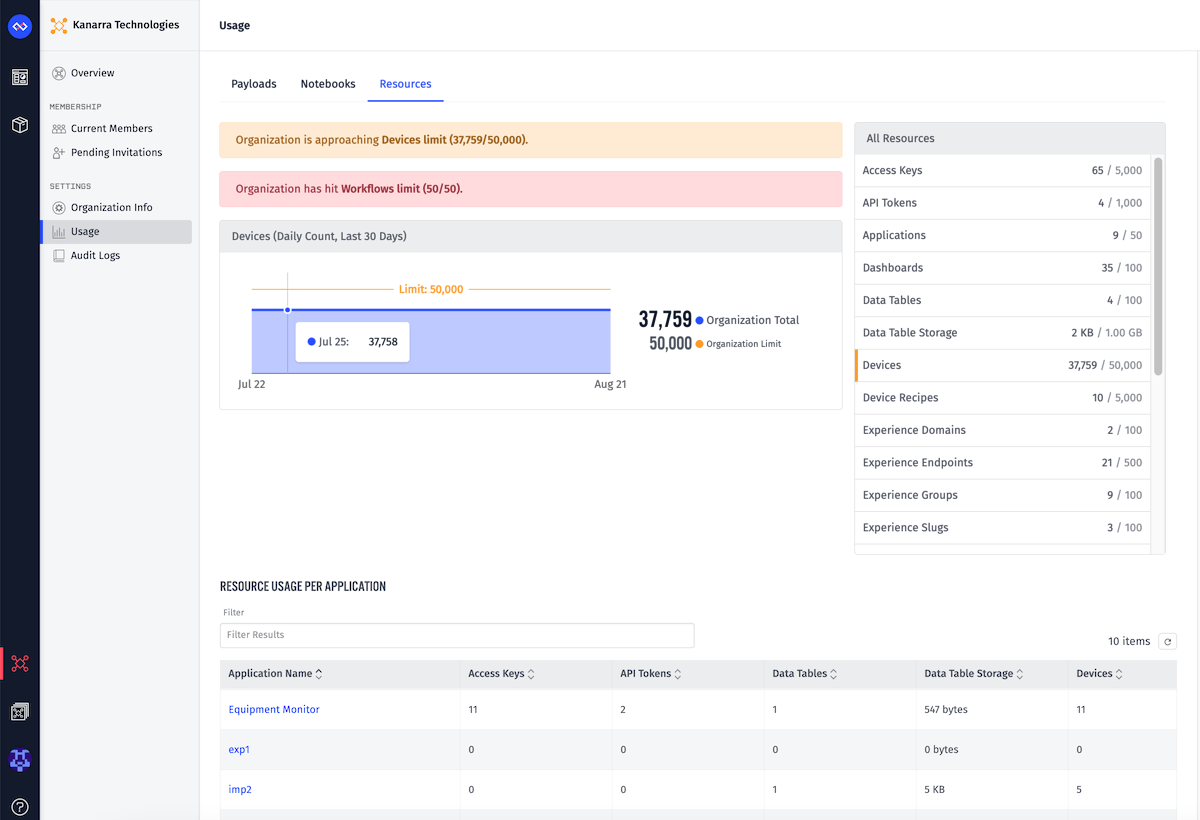
The Devices (Daily Count, Last 30 Days) graph displays the daily device count over the last 30 days, along with the organization device limit.
On the right side, the All Resources list displays your organization's resource usage and limits by each type. Any resources that are approaching or at their limit will be marked with a warning border, and an alert will be added to the top of the "Resources" tab for each such resource type.
At the bottom, the Resource Usage Per Application table breaks down the total resources count into usage per application.
Payload Limit
Organizations are subject to a monthly billable payload limit. The limit is typically set by instance administrators on creation of the organization, though it can be changed at any time.

At the top of the organization overview page, as well as at the top of the "Payloads" tab, Losant will provide an alert notifying organization members if the organization is approaching, exceeding, or on pace to exceed this monthly limit.
Note: The "on pace to exceed" message is based on the number of payloads per second generated during the period extrapolated over the course of the entire period. Therefore, if your payload usage dramatically changes, it may take some time before the changes are reflected in the prognosis.
Exceeding the Payload Limit
Losant will continue to accept payloads without any changes to functionality or performance if the organization exceeds the monthly billable payload limit; however, payloads in excess of the limit may be subject to overage fees. Instance administrators also have the option to disable acceptance of payloads for an organization at any time, which they may elect to do if payload limits are regularly and excessively surpassed.
Depending on whether your application is owned by an Organization or a Sandbox, the behavior of your account once a payload limit is hit varies.
Billable Payloads
The following are examples of billable payloads:
- A device reporting its state
- A command sent to a device
- Device connections to and disconnections from the Losant broker (or manually setting the status)
- MQTT inbound and outbound messages on custom topics
- Incoming webhook requests
- Incoming experience endpoint requests
- Incoming application emails
- Incoming integration messages
- Resource Job iterations, completions, and timeouts
- Virtual Button Trigger presses, including those triggered by an Input Controls Block
- Timer Triggers in Application Workflows (Edge Timer Triggers do not count towards payload limits)
- Device: Inactive Triggers
- Workflow Error Triggers
Non-Billable Payloads
The following are examples of non-billable payloads and thus do not count against the organization's monthly limit:
- Application file creations and modifications, or invocations of the File Trigger
- Event creations and modifications, or invocations of the Event Trigger
- Device creations and modifications, or invocations of the Device: Create Trigger
- Data requests, including those made by dashboards and device data exports
- Webhook replies in workflows
- Workflow runs triggered by another workflow through the Workflow Trigger Node
- Data table row insertions, deletions, edits, and queries, or invocations of the Data Table Trigger
Notebook Minute Limit
Organizations are also subject to a limit on the number of notebook execution minutes per month - or, the amount of time Losant spends executing your applications' Jupyter notebooks within our cloud platform.
Like the payload limit, the notebook minute limit is typically set by instance administrators on organization creation and may be changed at any time.
Unlike the payload limit, notebooks will not execute if the monthly minute limit has been exceeded.
Note: Execution minutes are not consumed while Losant is generating the notebook's inputs; the metered time begins after creation of the inputs and ends when the execution completes.
Was this page helpful?
Still looking for help? You can also search the Losant Forums or submit your question there.