How To Visualize Your Data at the Edge With Losant and InfluxDB
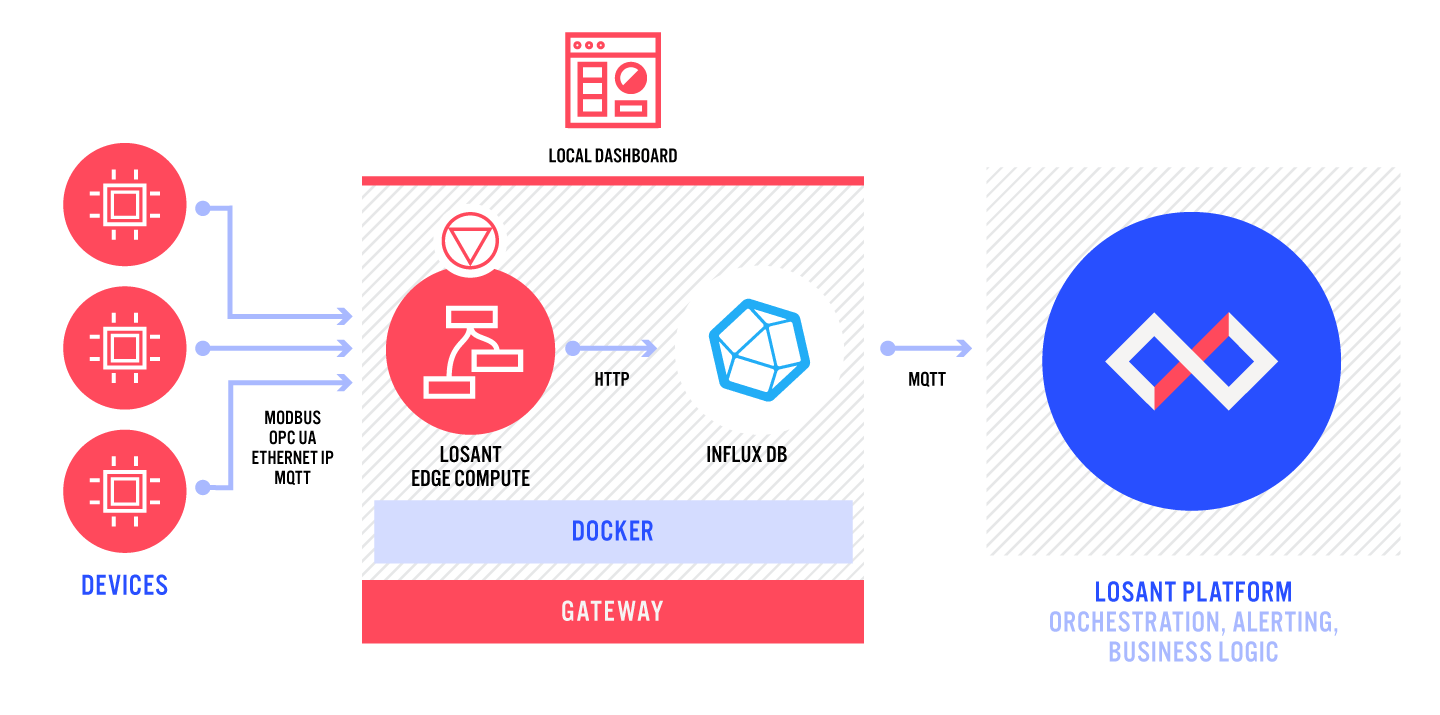
Visualizing your data at the edge can give you immediate insight into your data without the need to interact with the Cloud. InfluxDB 2.0 enables you to build and view dashboards on your gateway locally. In this guide, we will set up an InfluxDB Docker container alongside Losant's Gateway Edge Agent and have them communicate with each other so that you can build dashboards with InfluxDB.
What You Will Need
- A 64-bit operating system for the InfluxDB container
- Familiarity with Docker
- A running Gateway Edge Agent
Part 1: Create a Docker Network
Creating a Docker network for the InfluxDB container and the Gateway Edge Agent is necessary so that the two containers can communicate with one another. For the sake of this guide, we are only going to focus on creating a Docker network, connecting an already running container to that network, and starting a container that will connect to that network.
Container networking is a deep topic and one that we could spend a lot of time on. For more information on Docker networking, you should check out Docker’s documentation.
To create a Docker network, with Docker running, type the following command in your terminal:
docker network create main-net
This command creates a Docker network with the name main-net. You can, however, name this network however you would like.
Now, you can connect your running Gateway Edge Agent with this command:
docker network connect main-net <name-of-edge-agent-container>
Part 2: Run the InfluxDB Container
Now, we need to create a directory for the persistent data that we will maintain across restarts. This is for things like the data you will send to the InfluxDB container, user information, etc. You can do this with the following command, which will make an influxdb directory inside the already existing GEA directory you made if you followed along with our Gateway Edge Agent Usage documentation:
mkdir -p /var/lib/losant-edge-agent/influxdb/data
If you don’t already have the influxdb Docker image, the following command will pull down the latest version, or you can run docker pull influxdb before running the command below. To start the InfluxDB container, use the following command:
docker run -d -p 8086:8086 --network main-net --name influxdb \
  -v /var/lib/losant-edge-agent/influxdb/data:/var/lib/influxdb2 \
  influxdb
By default, InfluxDB serves its UI on port 8086, so we use the -p flag to publish the 8086 port of the container to the 8086 port of the host machine.
You can see, also, with --network main-net, we are starting this container on the network we created in Part 1, which allows this container and the GEA to communicate with each other.
As mentioned, we would like to persist data in InfluxDB across restarts, and we do that by mounting a volume on our machine to a volume in the container with -v /var/lib/losant-edge-agent/influxdb/data:/var/lib/influxdb2.
Note: InfluxDB does offer other configuration options for the container setup. To learn more about them, you can visit their documentation and learn more on their Docker Hub page.
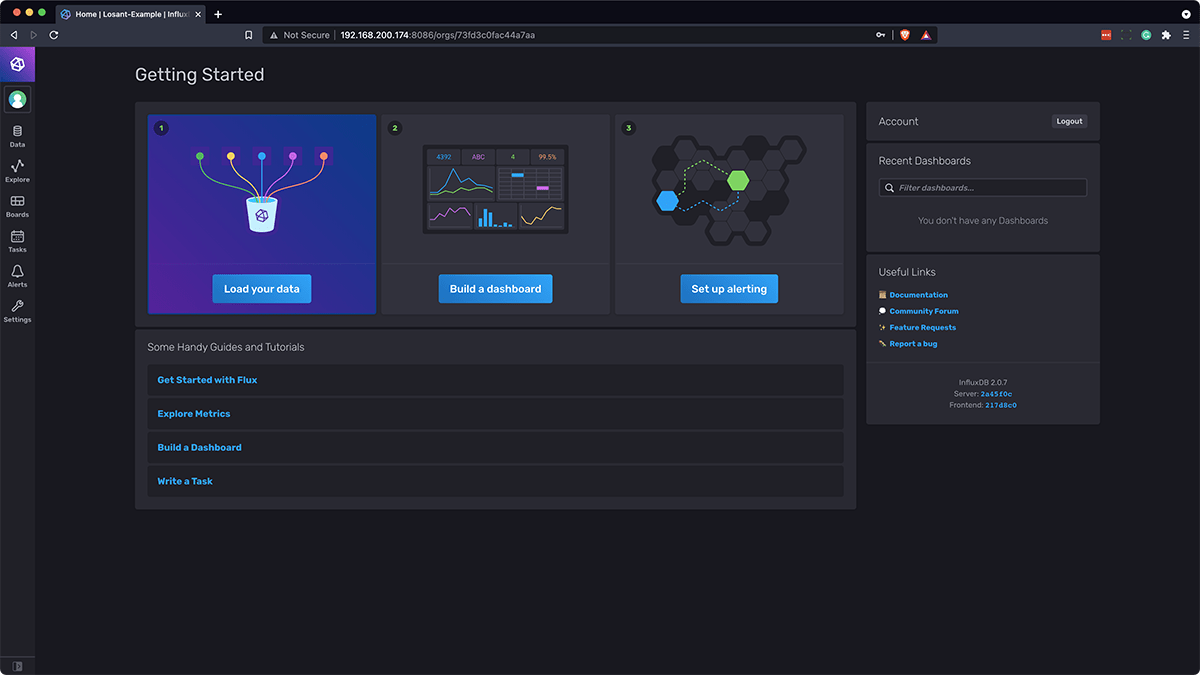
Now, you can navigate to http://<ip-address-of-gateway>:8086 and will be greeted with this screen:
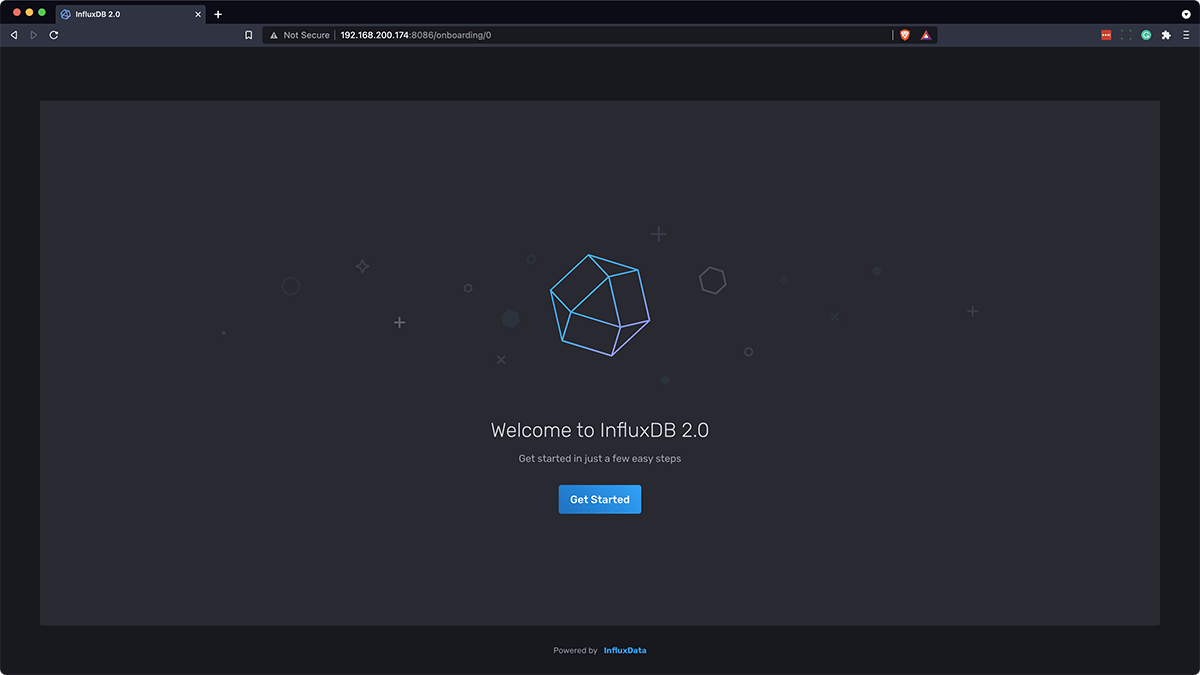
So now, we’re ready to set up InfluxDB.
Part 3: Set Up InfluxDB
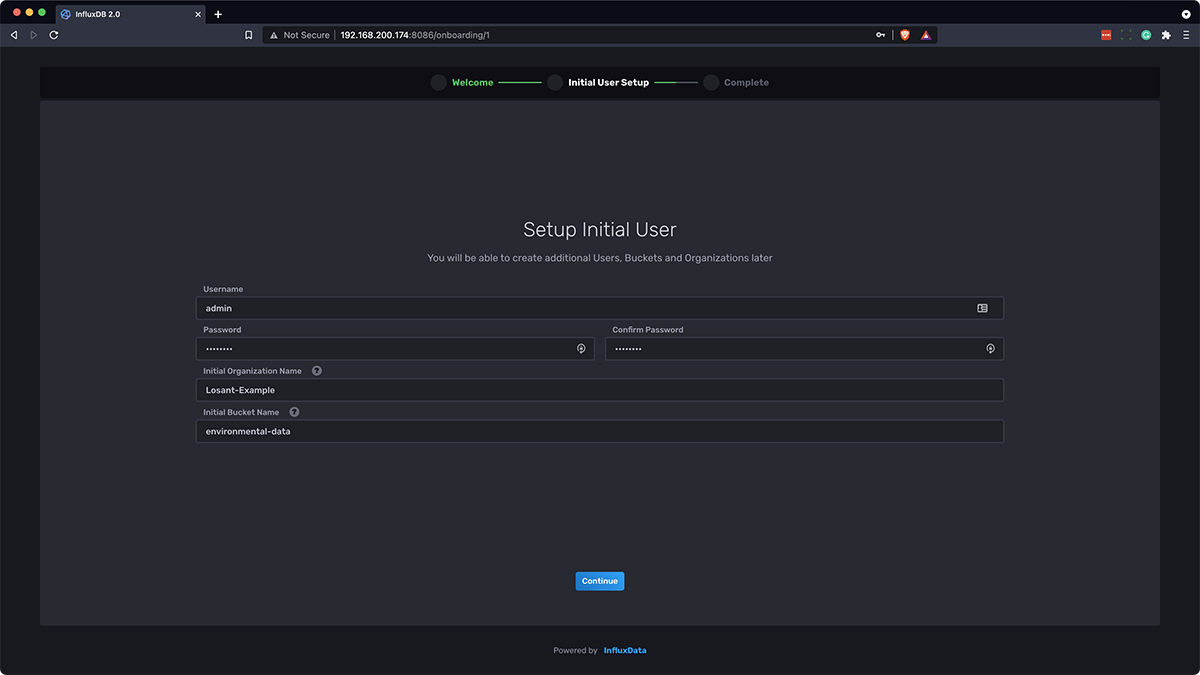
Next, click “Get Started”, and fill out the username (i.e. "admin"), password, organization name (i.e. "Losant-Example", "My Great Company"), and initial bucket name (i.e. "environmental-data" or something similar), and click “Continue.”
Then, on the right side, click “Configure Later”:
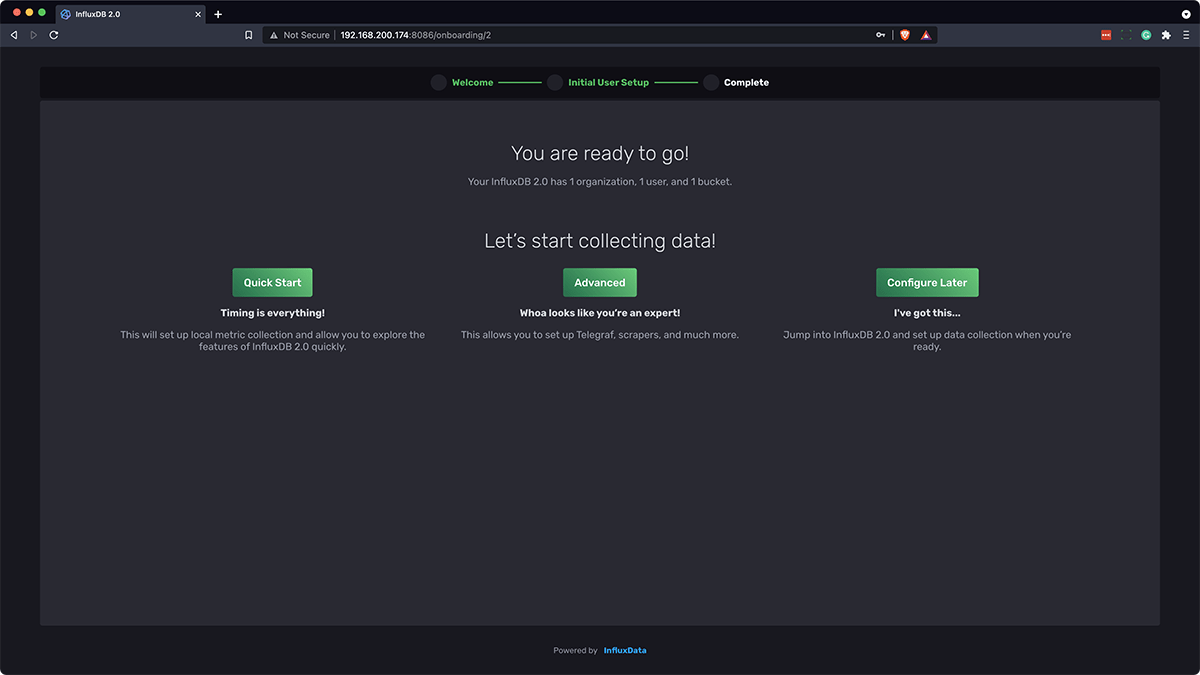
Finally, you should be greeted with this screen:
And that’s it! You’ve created an InfluxDB database with an admin user and an initial bucket and are now ready to start getting data from your Gateway Edge Agent to your InfluxDB container.
Part 4: Sending Data to InfluxDB from the GEA
Now, let’s make a simple Losant Edge Workflow that looks something like this:
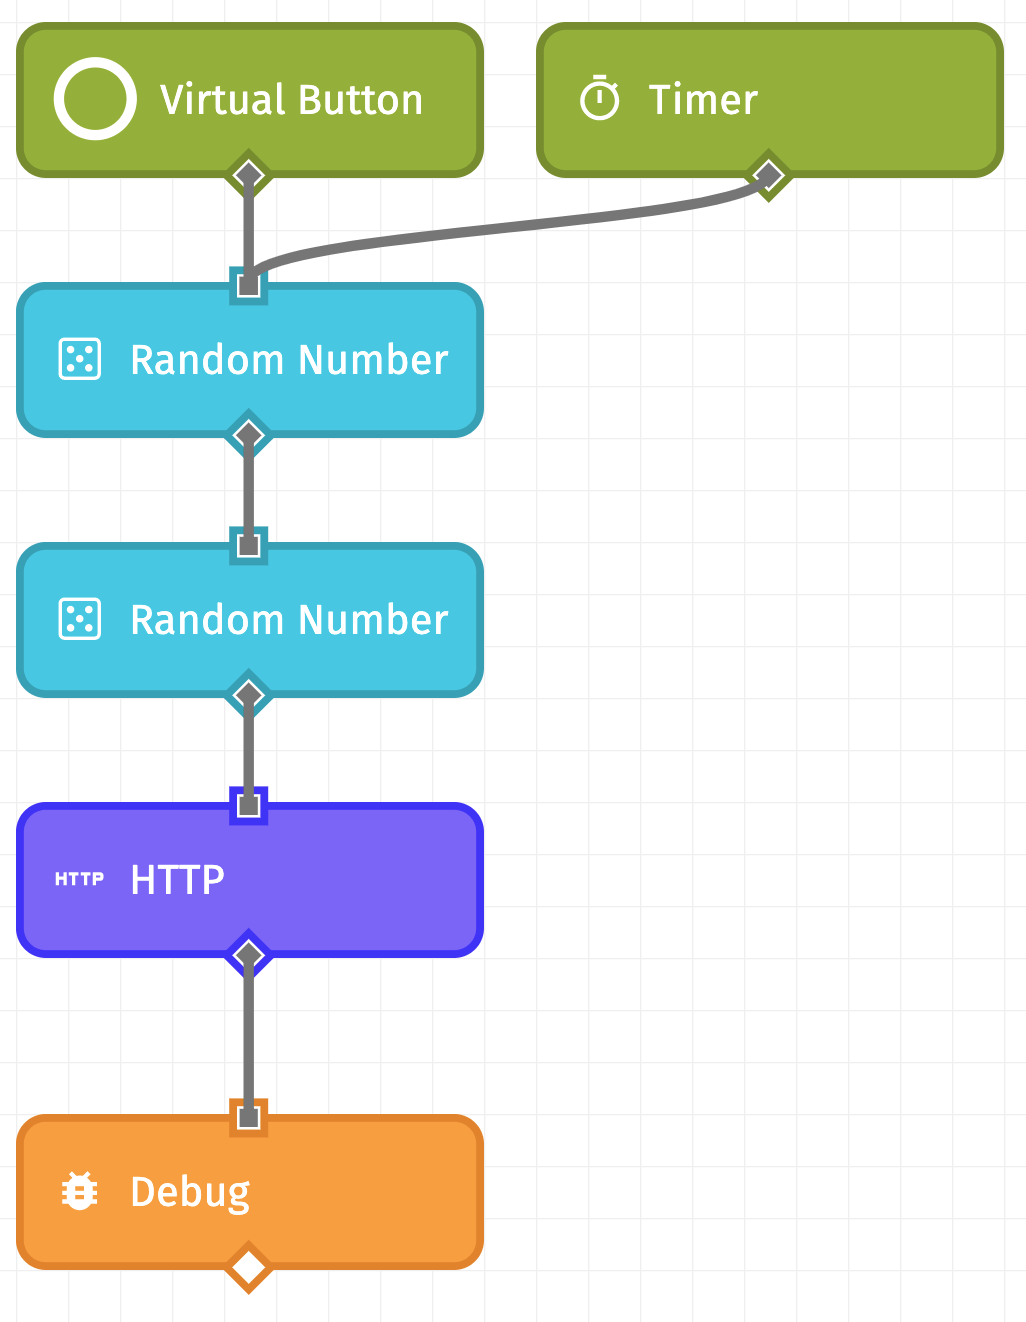
As you can see, this workflow consists of a Virtual Button Trigger, a Timer Trigger set to a simple timer of 10 seconds, two Random Number Nodes (both with minimum values of 0 and maximum values of 100), an HTTP Node, and a Debug Node. The first Random Number Node is going to be our simulated “Temperature”, so we put the value at data.temperature, and the second Random Number node is our simulated “Humidity”, which we place at data.humidity. This workflow does not send device state up to the Losant Cloud, but if you would also like to report your data to the Cloud for further analysis and other business logic, you can do so by adding a Device: State Node.
Next, we have the HTTP Node. It requires the most configuration, so let’s walk through it.
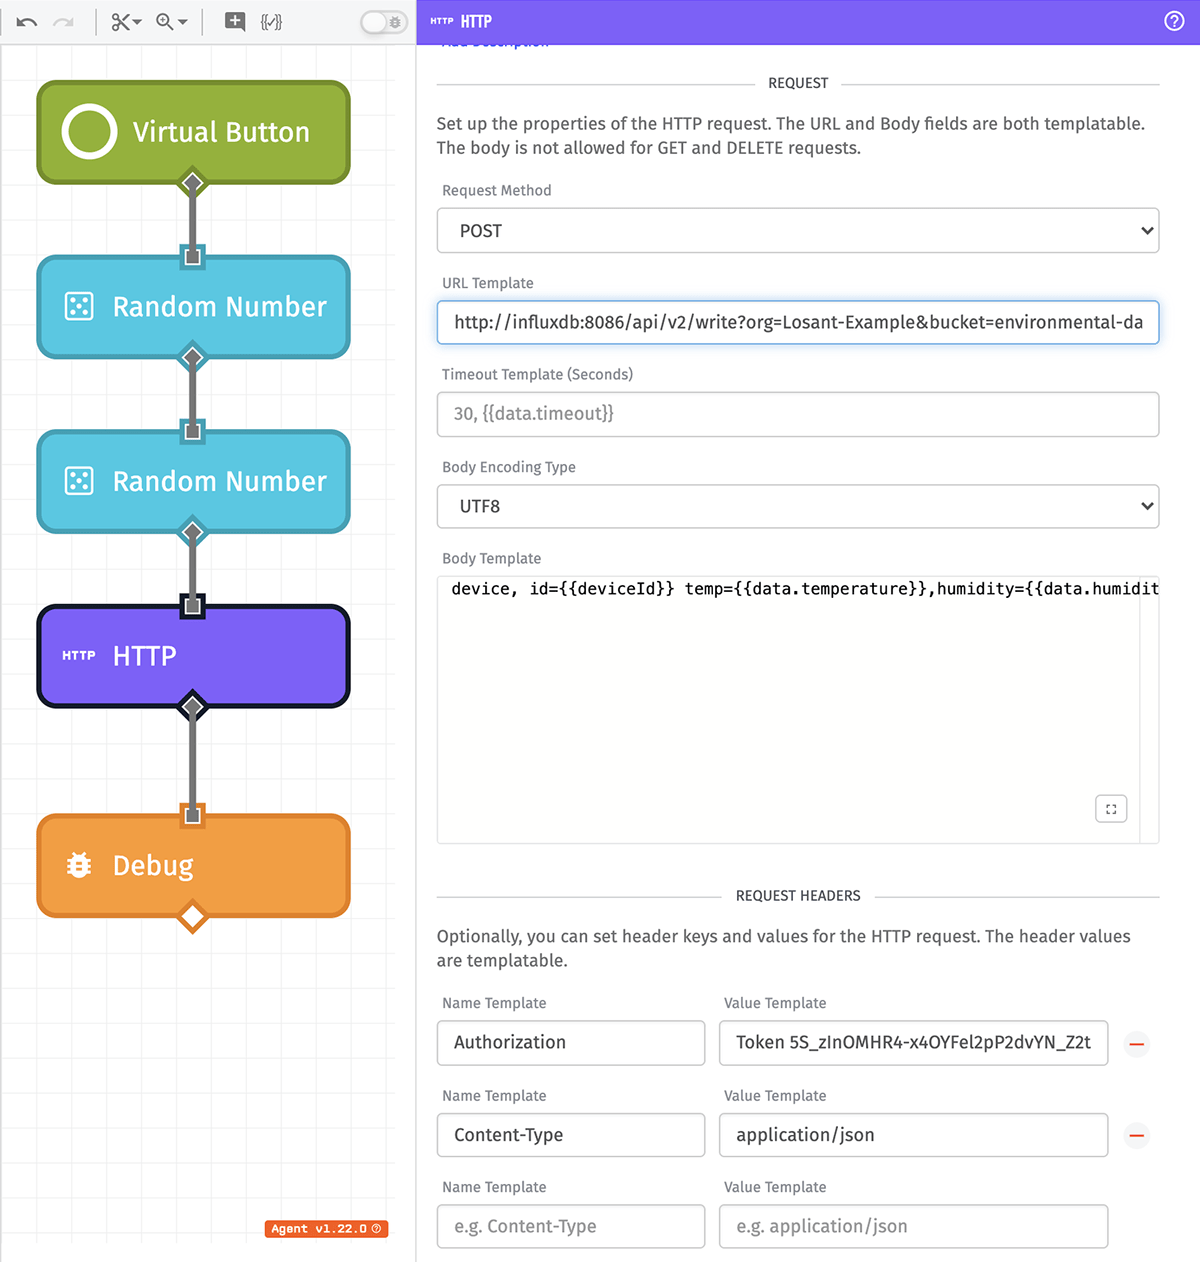
Let’s break down the HTTP Node configuration. We’re making a POST request to the address:
http://<name-of-influx-container>:8086/api/v2/write?org=Losant-Example&bucket=environmental-data
<name-of-influx-container>is the name of the InfluxDB container that you used in Part 2 with the--nameflag in the Docker run command. In this case,--name influxdbwas used so our address ishttp://influxdb:8086orgis the name of the org we created in Part 3, or “Losant-Example”bucketis the name of the bucket we created in Part 3, or “environmental-data”
Note: For more information about the InfluxDB API, check out their documentation, specifically the Write Data API.
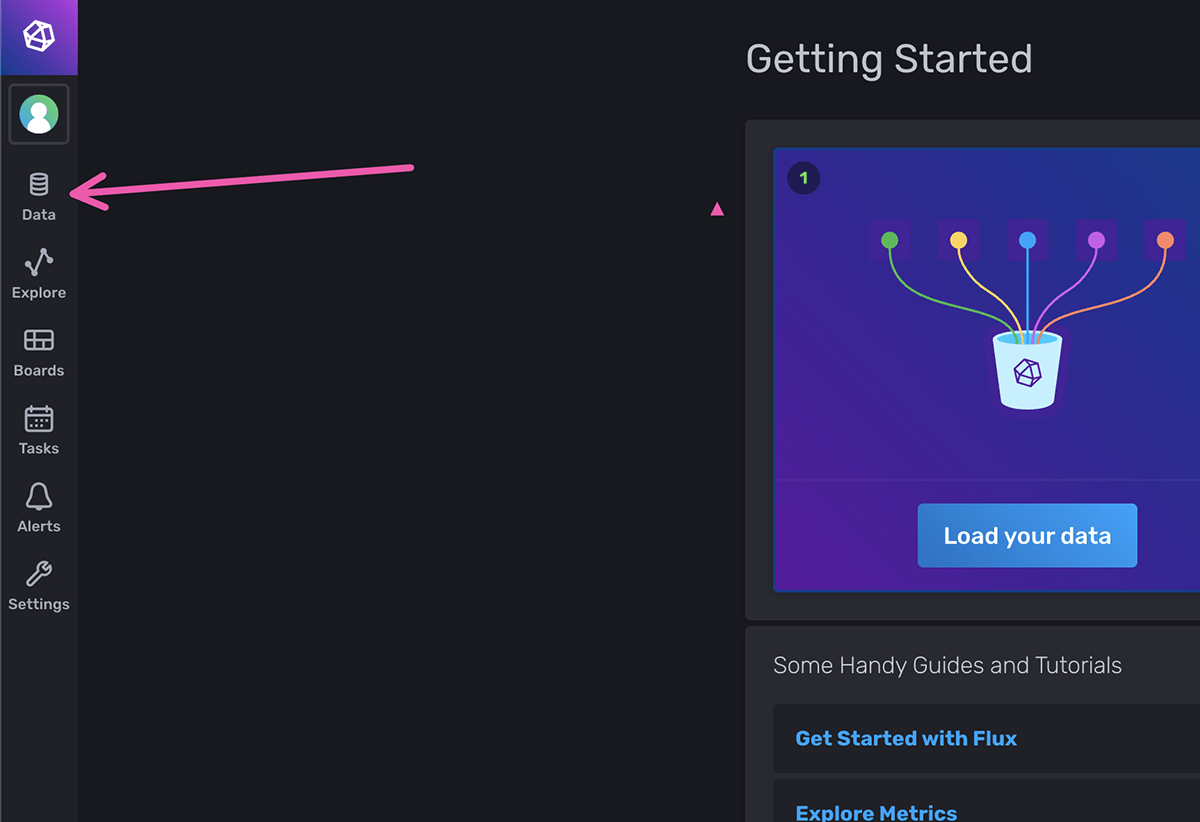
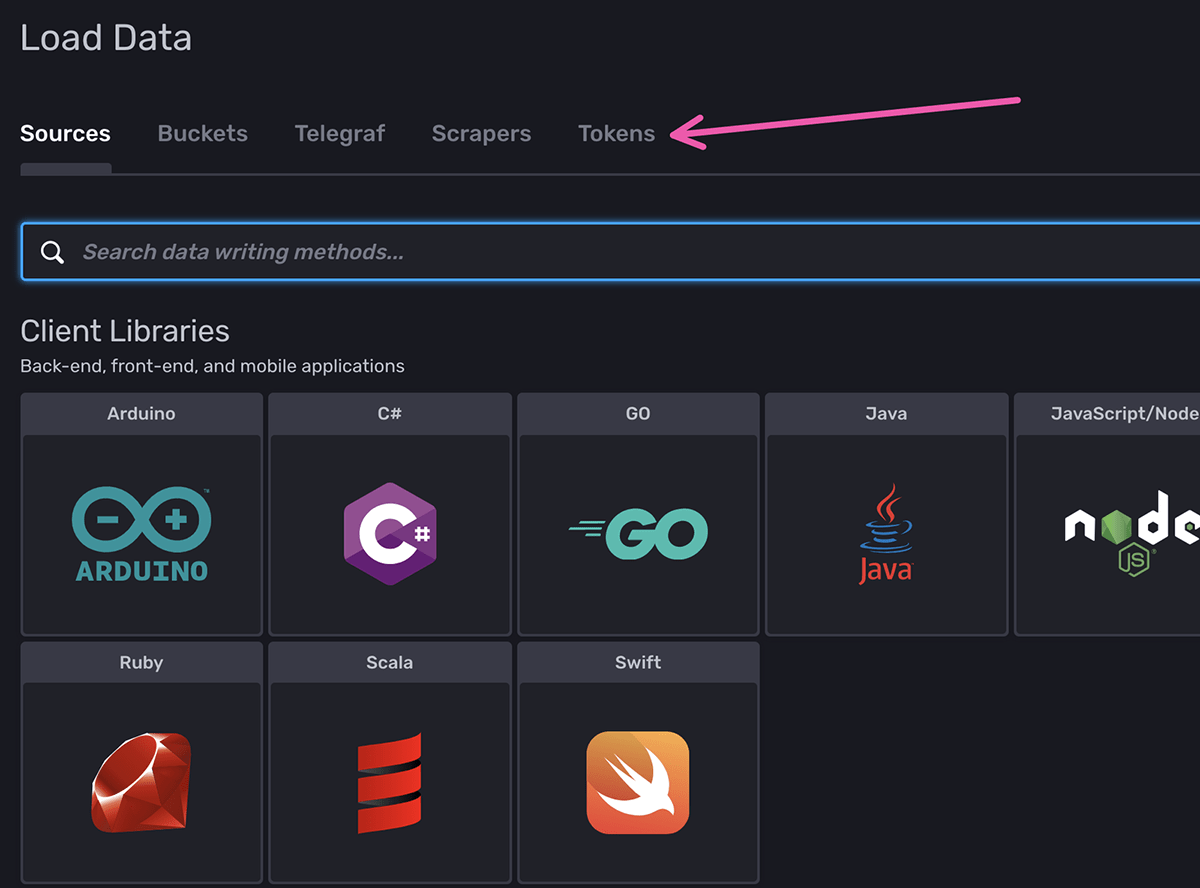
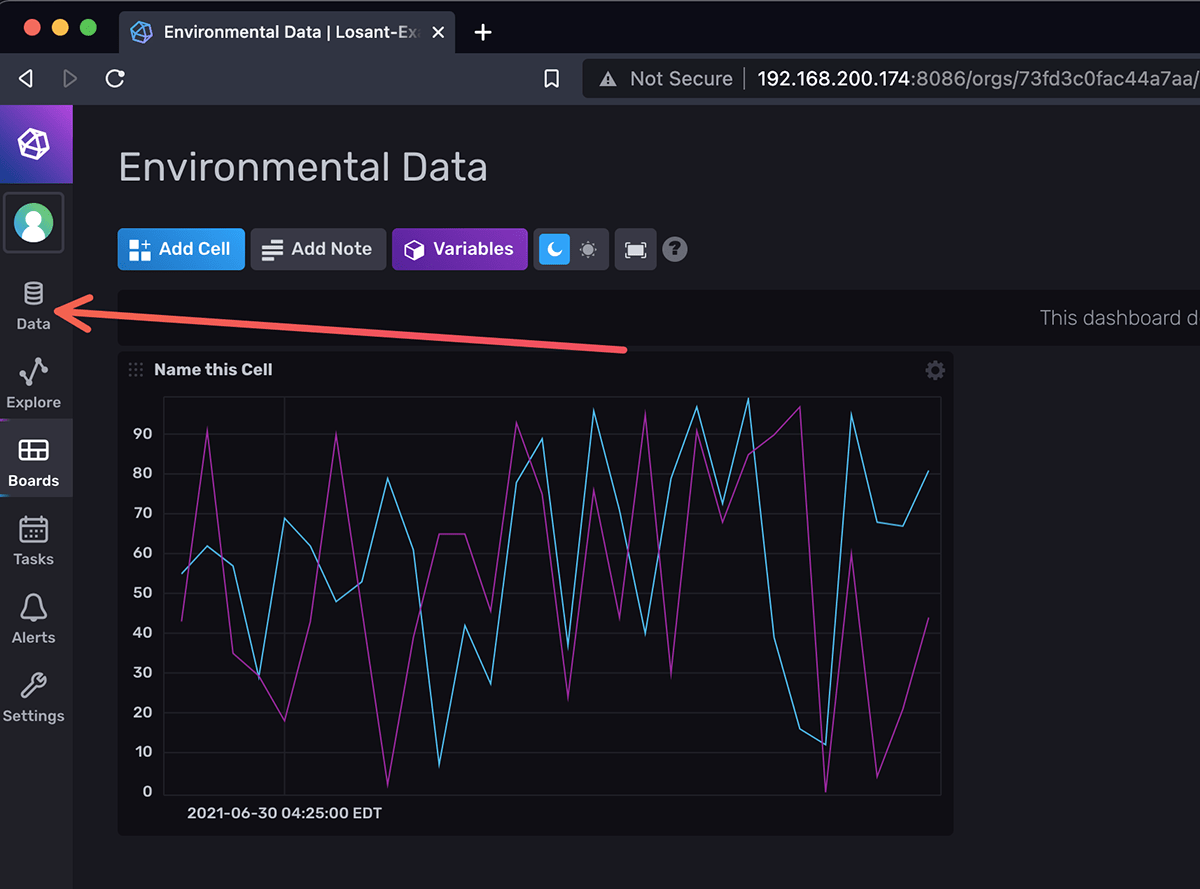
In the Request Headers, we need an Authorization token, which you can create by going back to the InfluxDB UI and clicking Data:
Then, click “Tokens”:
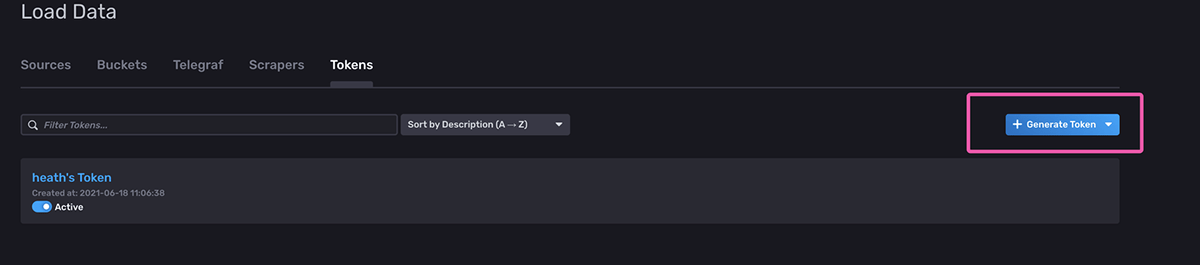
Next, in the top right, click “Generate Token” and click “Read/Write Token”:
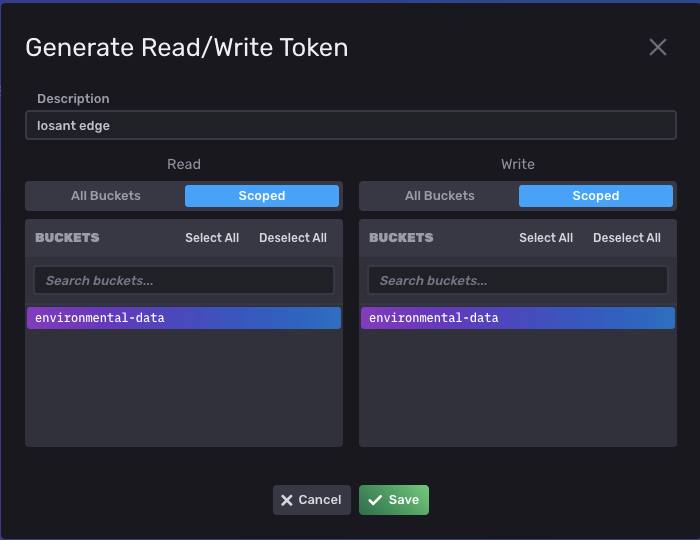
Then, we want to scope the token to the bucket we created (it’s also a good idea to add a description for this token):
Once you click Save, you will be taken to the main token screen again. Click the token you just created and click “Copy to Clipboard”:
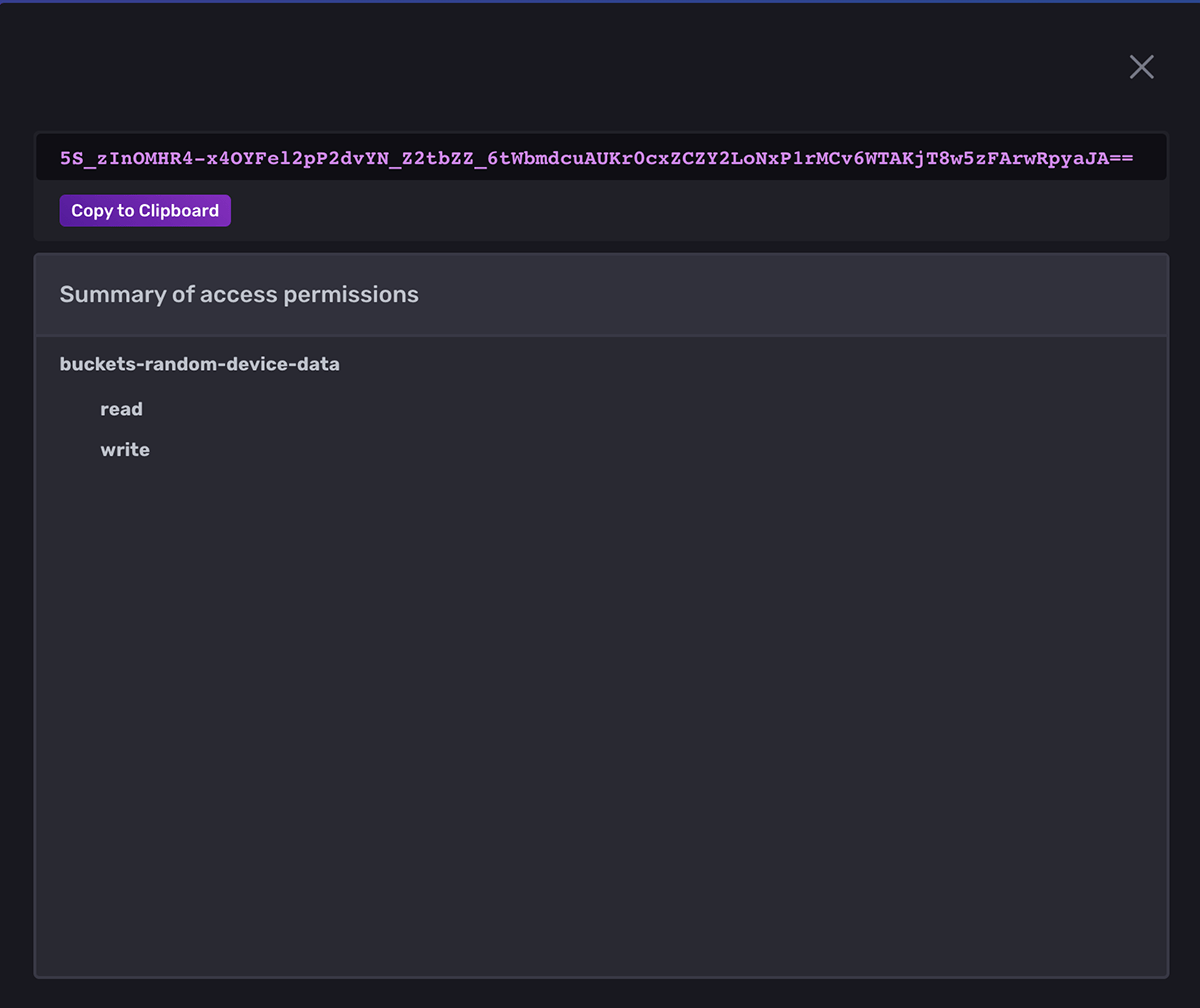
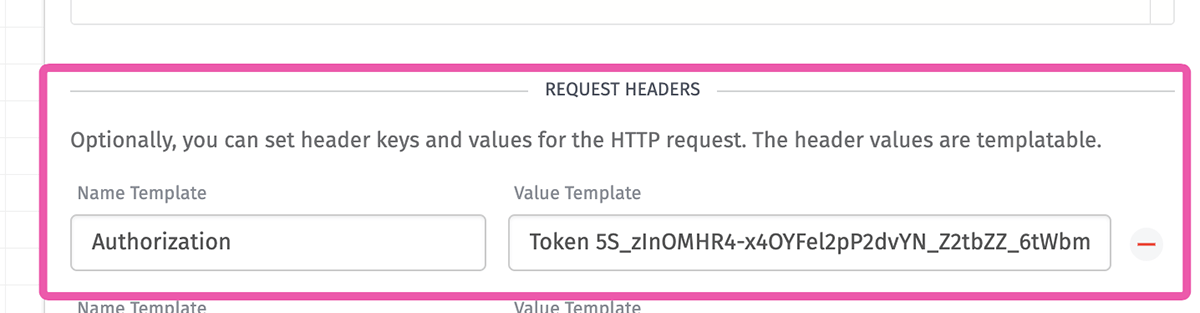
Now that the Authorization token is in your clipboard, go back to the HTTP Node configuration in Losant and paste it with Authorization as the name, and Token YOUR_TOKEN_HERE as the value. Your Authorization Request Header should look like this:
For the body of the request, we are sending those two random values as temperature and humidity to InfluxDB as:
device,id={{deviceId}} temp={{data.temperature}},humidity={{data.humidity}}
This follows InfluxDB’s Line Protocol to insert data into the data store. For this example, device is the name we are giving to the measurement. id is a tag for that measurement. When different device IDs are used, InfluxDB will give you the ability to add dashboard cells for different devices by ID, or add cells that show multiple devices at once. temp and humidity, separated by a comma, are the field set for this reading.
In a case where your gateway is reading values from peripherals, you would add the ID of the peripheral to the payload and instead of referencing {{deviceId}}, you would reference the ID of the peripheral. Further, you could leverage the #each template helper to add multiple lines for multiple different peripheral devices in one request.
This HTTP Node configuration and body syntax are the cornerstones of this workflow. Once you have this working, you can reuse this HTTP Node in multiple workflows to send specific data to an InfluxDB Bucket. You can even create separate buckets in InfluxDB to categorize your data.
Next, we’ll see how we can create and access InfluxDB Dashboards right from the edge.
Part 5: Building an InfluxDB Dashboard
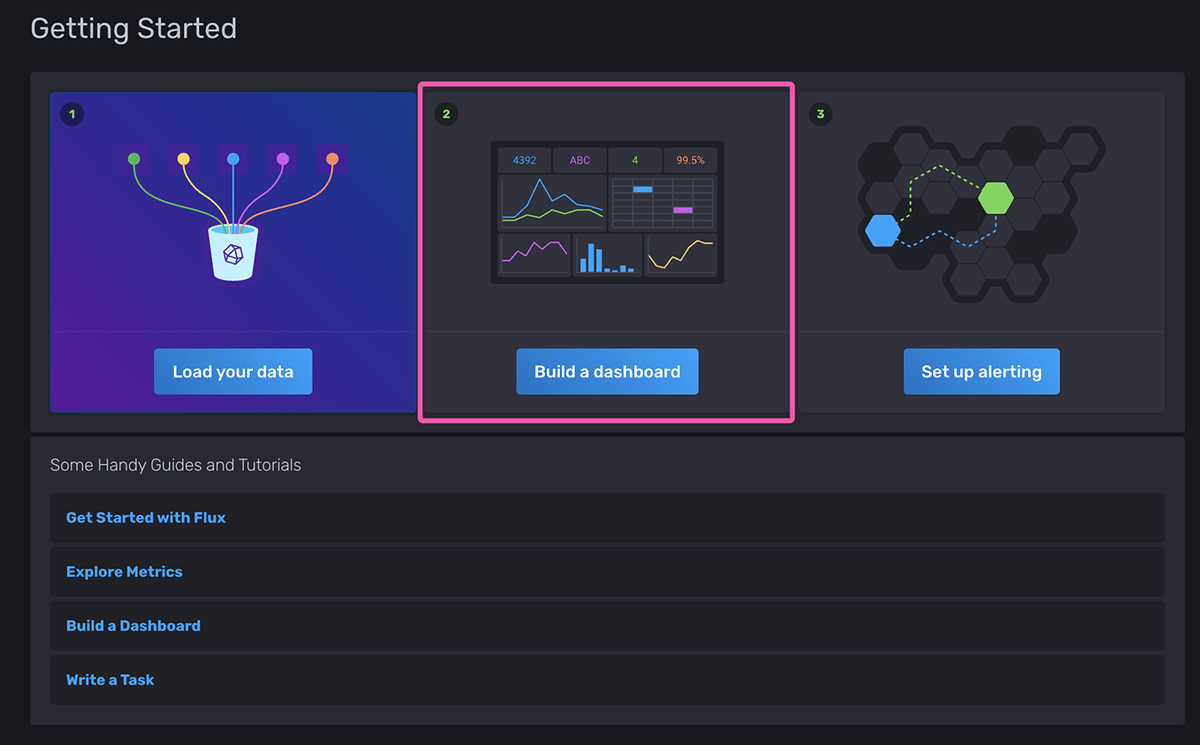
Next, let’s create a dashboard. You can do this by going back to the main screen or by clicking “Boards” in the left-side navigation:
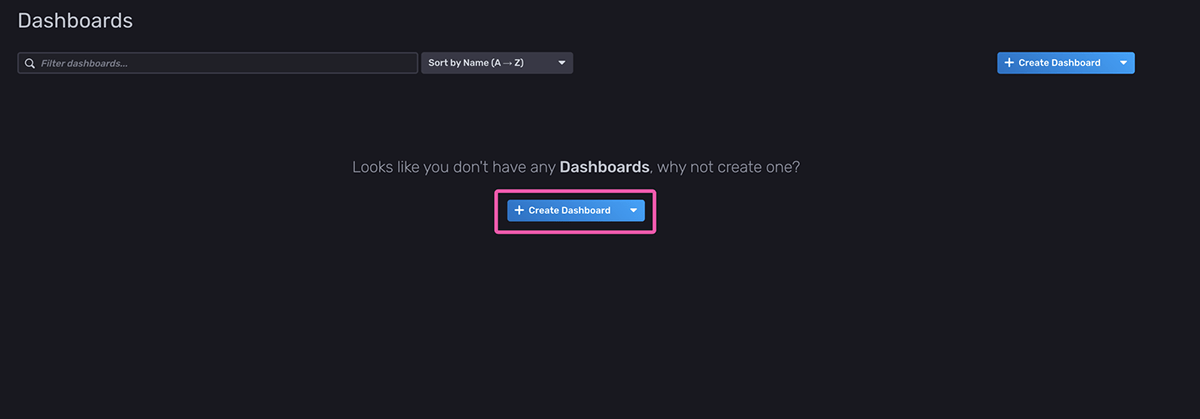
Then, click “Create Dashboard”:
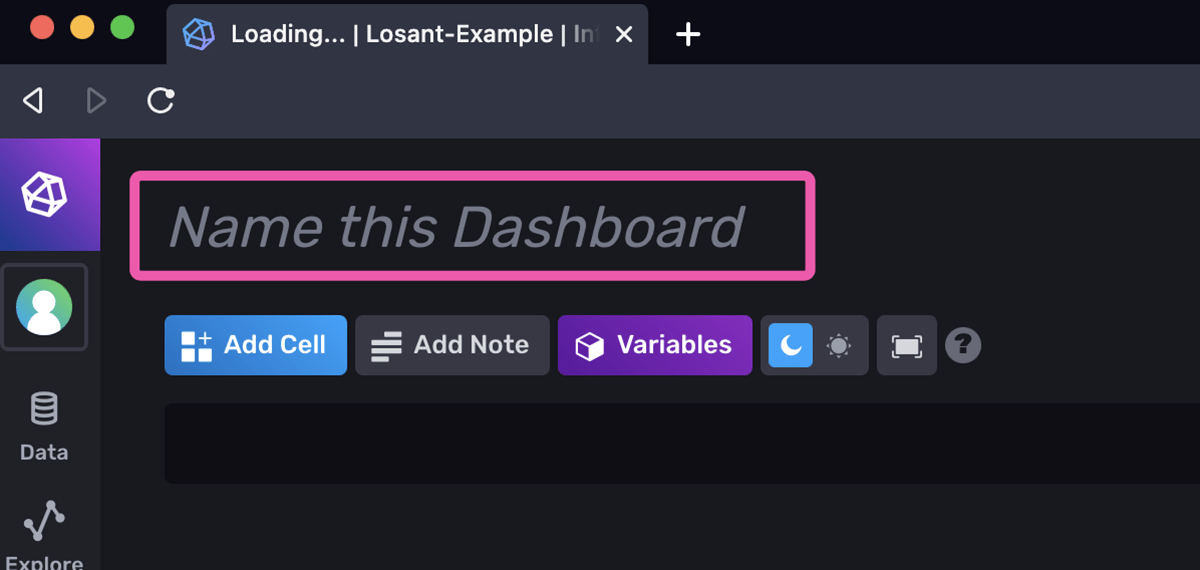
In the top left, where it says “Name this Dashboard”, let’s name it “Temperature & Humidity.” Then, underneath, click “Add Cell”:
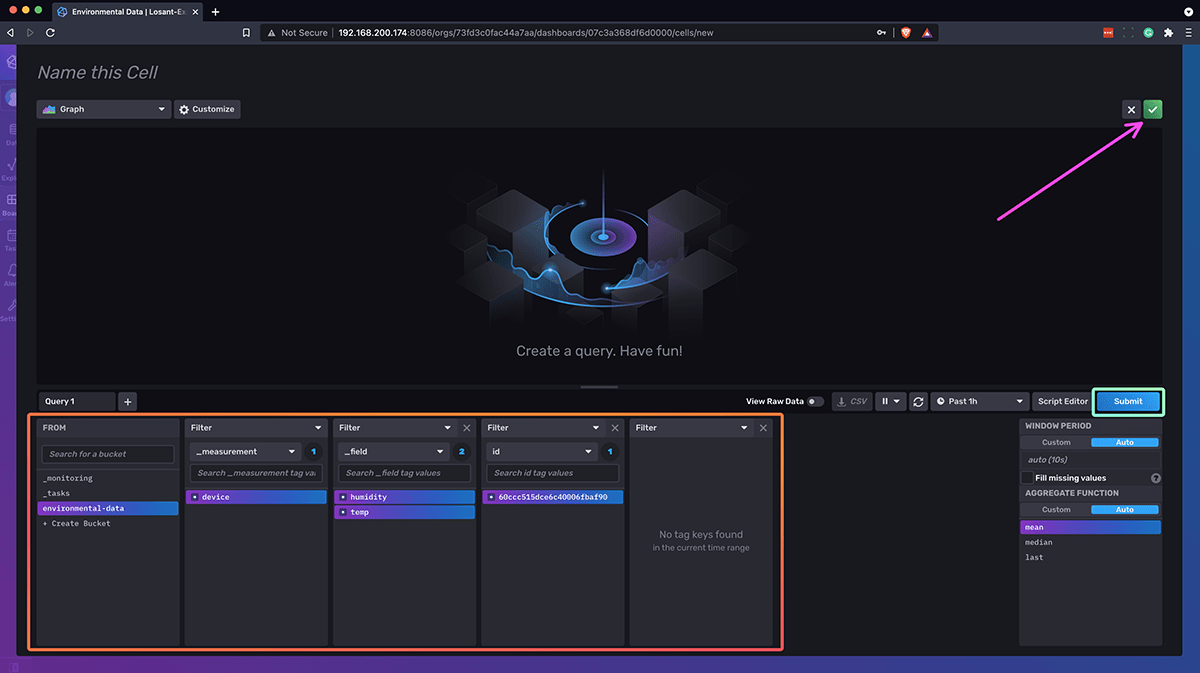
For this example, we’re going to create a Graph cell, making sure that the environmental-data bucket is selected. Then, check the box for device, the boxes for humidity and temperature, the box for the ID of the device reporting its data, choosing the last aggregate function, and finally click submit, which will set the query used for this dashboard cell. Your modal should look something like this:
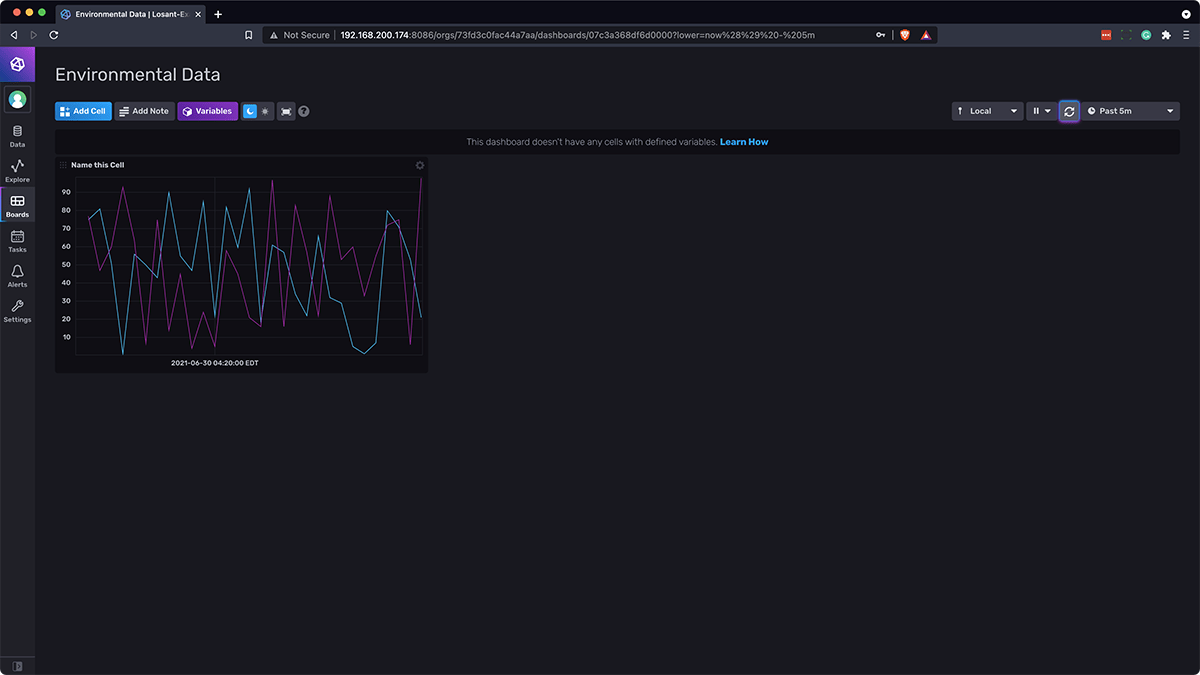
Your dashboard should now look similar to this (you may need to press the Virtual Button a few times in your edge workflow to send data to InfluxDB):
Part 6: Accessing an InfluxDB Dashboard
To access the dashboard you just created, while on the same network as the device running InfluxDB go to the URL of the dashboard on a different machine. Once you press enter, you will be taken to this screen:
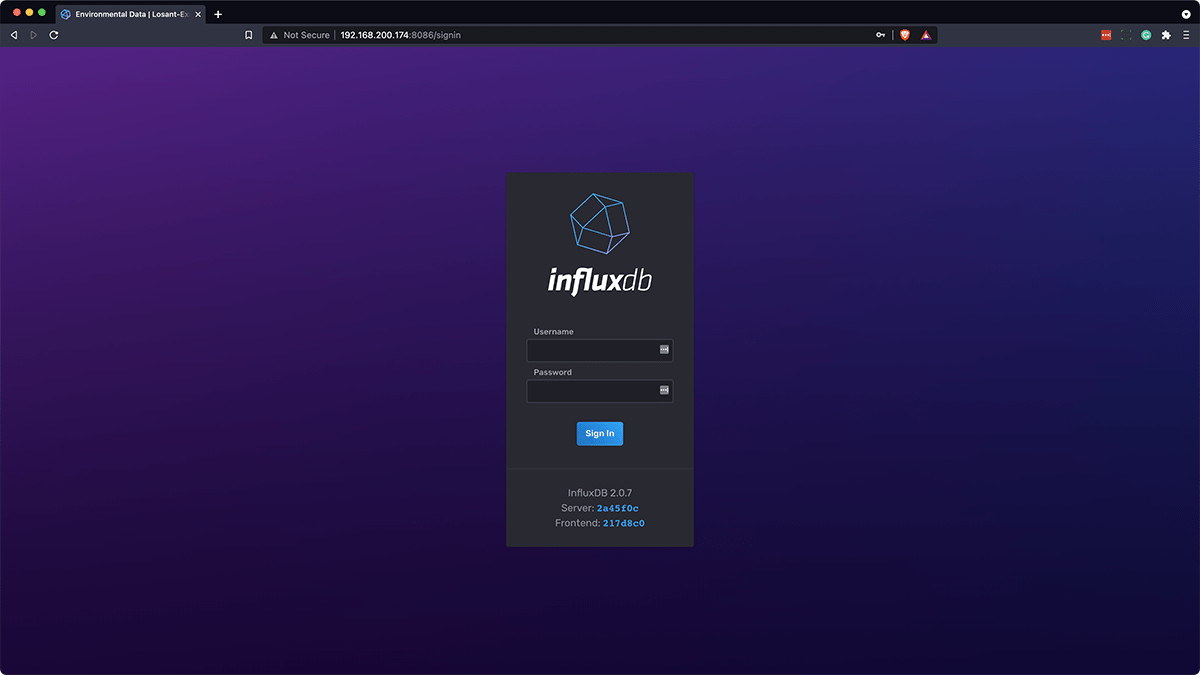
To sign in, enter the username and password that you used in Part 3. This user is the database admin who has full permission over this database. If you would like to create a new user, you can follow the InfluxDB documentation to create a user with the CLI, so that those who log in to view your dashboard cannot remove resources.
Part 7: Querying Data from InfluxDB
As more and more data is sent to InfluxDB, you may want to query that data for use in a Losant Workflow. Let's query some data that we're sending from the workflow above. To query data from InfluxDB using the GEA, make a new edge workflow that looks like this:

This workflow is a bit similar to the workflow earlier in this guide and consists of a Virtual Button Node, an HTTP Data Node, a CSV: Decode Node, and a Debug Node.
The HTTP Node, again, requires the most configuration, so let's take a closer look:
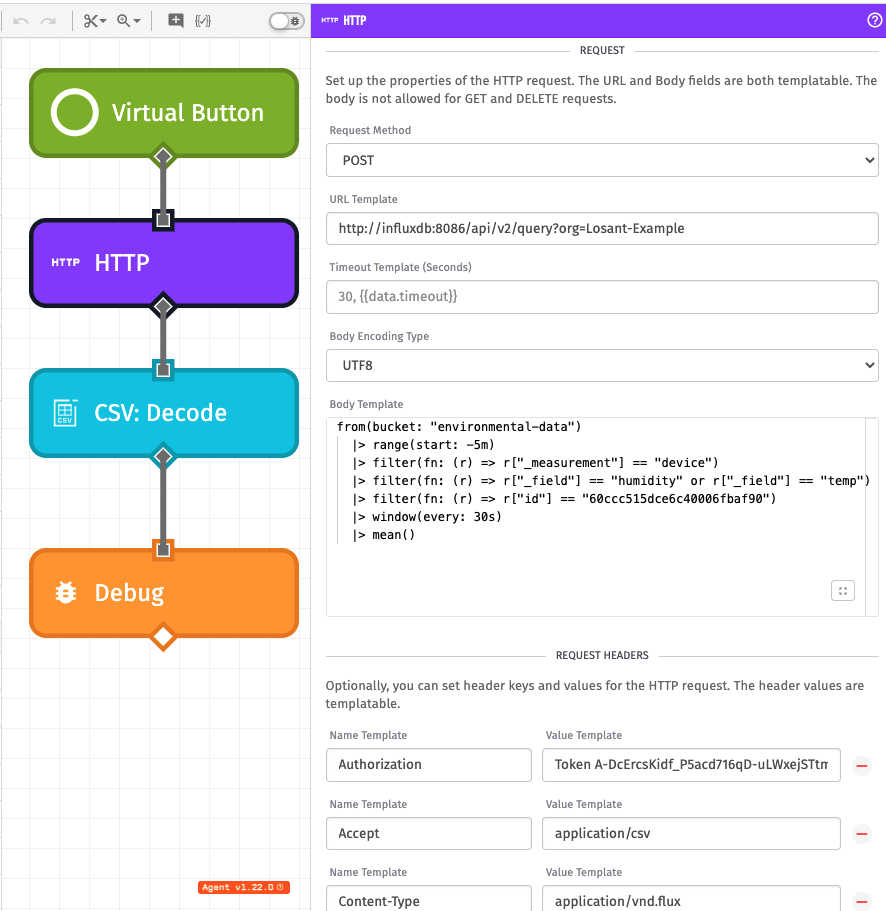
We are making another POST request to http://influxdb:8086/api/v2/query?org=Losant-Example. This URL is a bit different than the one we used in the previous HTTP Node, so let's break it down:
- The root of the URL is still the same as Part 3; you are still making a request to
http://<name-of-influx-container>/api/v2where<name-of-influx-container>is the name you used with the--nameflag in the Docker run command you used to start the InfluxDB container. - Instead of the
writeAPI endpoint, we are using thequeryendpoint with a query parameter of our organization name that we set up in Part 3. In this case, we useLosant-Example.
Now, let's take a look at the body we are sending in this POST request:
from(bucket: "environmental-data")
|> range(start: -5m)
|> filter(fn: (r) => r["_measurement"] == "device")
|> filter(fn: (r) => r["_field"] == "humidity" or r["_field"] == "temp")
|> filter(fn: (r) => r["id"] == "60ccc515dce6c40006fbaf90")
  |> window(every: 30s)
  |> mean()
InfluxDB uses its own Flux Querying Language to build queries for data, and it is unique, so let's break it down:
from(bucket: "environmental-data")
Here we are requesting data from the environmental-data bucket that was set up in Part 3.
range(start: -5m)
range with a start of negative 5 minutes is retrieving the last 5 minutes of data.
|> filter(fn: (r) => r["_measurement"] == "device")
|> filter(fn: (r) => r["_field"] == "humidity" or r["_field"] == "temp")
|> filter(fn: (r) => r["id"] == "{{deviceId}}")
These filter functions are similar to SQL WHERE statements, which are being used to filter the measurement, field, and id of the data.
|> window(every: 30s)
|> mean()
These two lines are Window and Aggregate methods that, in a way, put the returned data from the range and filters into "buckets" for the mean() aggregate function to run.
The request headers for this HTTP node are different, as well.
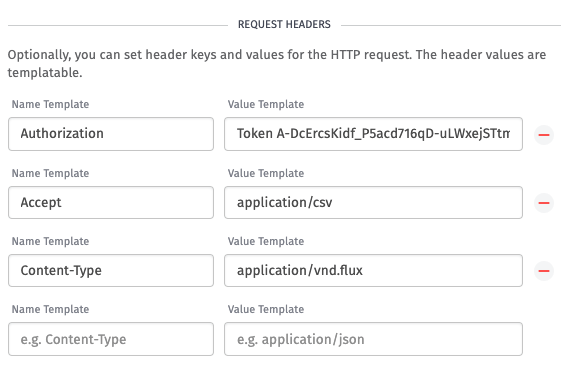
We are still using the same Authorization header with a value of Token YOUR_TOKEN_HERE. But this time, we are adding:
Acceptheader with a value ofapplication/csvContent-Typeofapplication/vnd.flux
Note: All of the headers mentioned for this request are required.
Then, the HTTP response that InfluxDB provides is stored on the payload at the path working.httpRes. With a successful HTTP request, the response data you will receive is encoded CSV data. So, in your workflow, you use a CSV: Decode Node to decode the response data. The CSV: Decode Node is configured as follows:
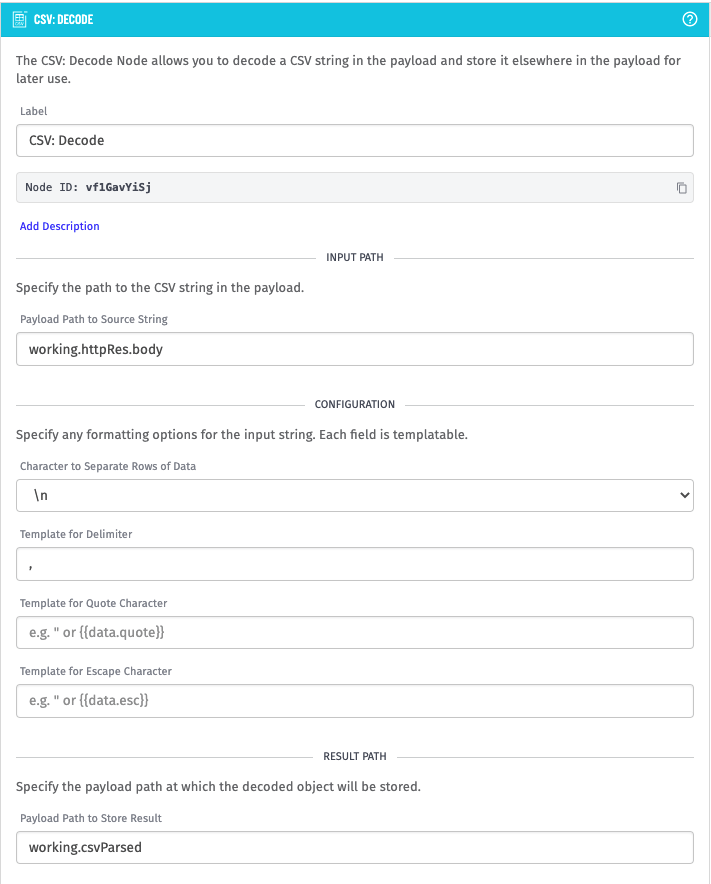
The CSV data returned by the query is comma-separated, and separates rows with \n. Then, the parsed CSV data is stored back on the payload at working.csvParsed to then be operated on in subsequent nodes, or in another workflow.
InfluxDB Data Retention Considerations
InfluxDB does allow you to change the retention policy of each bucket that you create. The way the bucket environmental-data was created in this guide, the retention policy is Forever. This is acceptable for testing purposes, but in a production environment using the Forever retention policy will end up using all of your gateway's storage space.
To change this policy, click on Data in the left navigation menu of the InfluxDB UI:
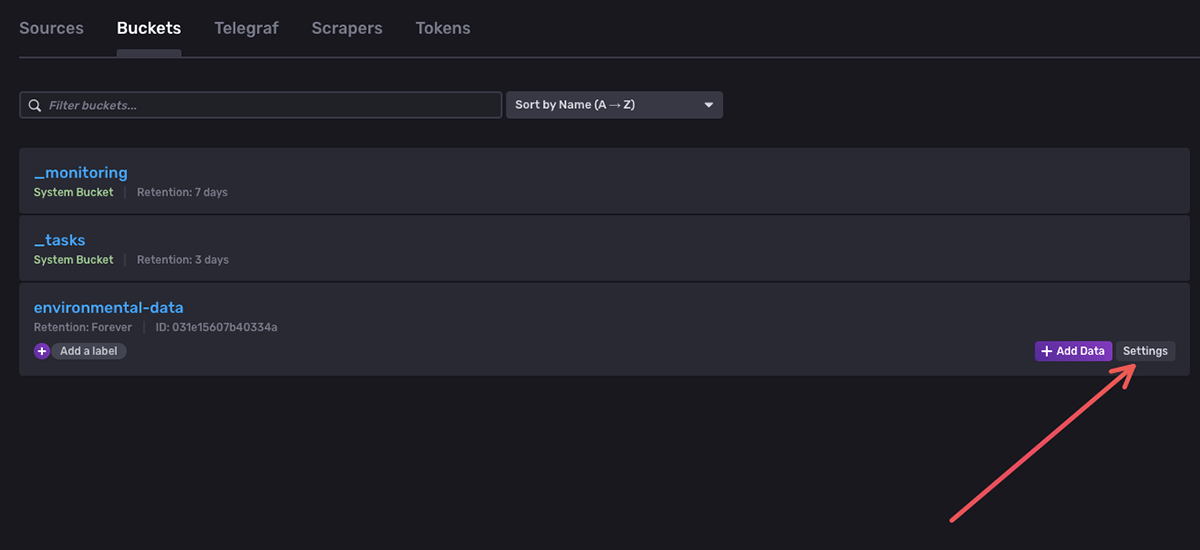
Then, click “Buckets” at the top:
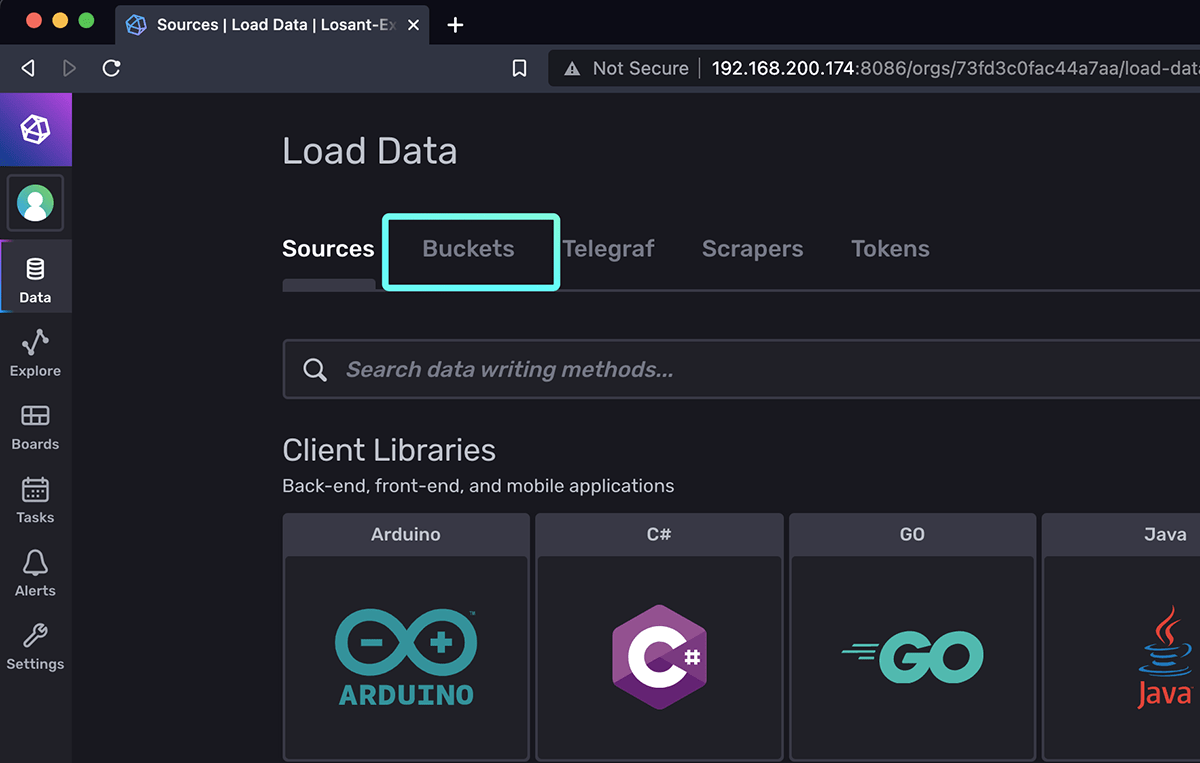
Then, for the environmental-data bucket, click the “Settings” Icon:
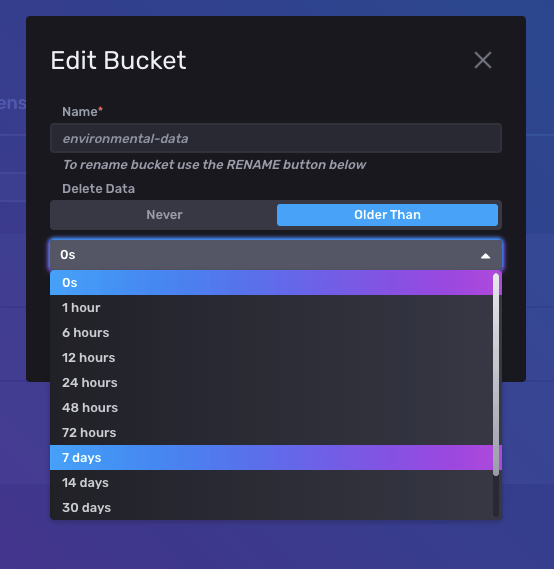
Click where it says “0s” to open the dropdown window, and you can select a data retention policy that fits your use case. For example, 7 days:
Resources
Was this page helpful?
Still looking for help? You can also search the Losant Forums or submit your question there.