Debugging Workflows
Development of any application requires the use of tools for checking data at various steps; tracing the steps a given input followed through a program; and benchmarking performance for different inputs and methods of arriving at a desired output. For Losant Workflows, we expose these tools through a debug panel, which is accessible in the right column of the workflow editor.

Workflow debug messages provide three pieces of information that are essential to debugging workflows and improving performance:
- Full payload data (optionally scoped to a given property) at the time a message was invoked, including any mutations made up to the point the message was sent.
- An execution path of which nodes preceded the node that recorded the message, detailing how node configurations respond to a given input.
- Per-node execution times for identifying performance bottlenecks and testing alternative approaches to arriving at desired outputs.
Debug streams are ephemeral–meaning that generated messages are not stored by Losant. Thus, they are only accessible while a user is connected to a debug stream, and the content is discarded as soon as the web browser navigates away from the workflow.
Viewing Debug Output
Debug messages can be found in the debug panel within the workflow editor. New messages appear in this panel automatically as they are received. If the panel is collapsed, an icon will appear in the debug tab indicating the there are new messages to view since the last time the panel was open.

Hovering your mouse over a debug message will highlight the path of the workflow that led to the node that produced the output. This allows for a quick visualization of which nodes were executed and which branches were taken (i.e. in Conditional Nodes and Switch Nodes).
There are a few actions users may take in the panel header to help view and filter debug output, as well as additional configuration in the debug options menu ...

- Users may filter debug output by the "Message" property for each entry, regardless of the message type. For Debug Node messages, this property is configurable as a string template rendering against the debug payload per each node. To search for debug log entries matching a given message, enter a case-insensitive string in the input at the top of the debug panel. Any entries with a "Message" matching that string will be displayed.
- By clicking the "Mute/Unmute" icon in the header, users may quickly mute all Debug Nodes on the stage - or, if there are any nodes currently muted, clicking the icon will unmute all muted nodes. (Note: Taking this action will cause the debug log to disconnect and reconnect with the new settings applied.)
- By clicking the "Play/Pause" icon, users may temporarily pause debug output, which allows for closer inspection of entries currently in the log and preventing newly received messages from appearing. This is especially useful in workflows with high debug output. Clicking the "Play/Pause" button again when the log is paused will add all messages received during the paused period to the log.
- Clicking the "Clear" icon will clear all messages out of the debug log. Clicking this will also unpause the log if it was paused at the time the messages were cleared.
Depending on the type of workflow being viewed, there are some behavior differences to note about the debug panel.
Application Workflows
When viewing an Application Workflow, all messages generated by all versions of the workflow will appear in the debug panel. While the message itself, including the payload and timing information, can be read regardless of which version you are currently viewing, the path the nodes took to reach the source of the debug message can only be viewed when the workflow editor is displaying the same version that generated the debug message.
Experience Workflows
Experience Workflows, by contrast, only display messages generated by the version currently being viewed.
Custom Nodes
Executions of Custom Node instances within your workflows (as in, invocations of the node) do not appear in the custom node editor's debug panel. Rather, only messages generated through the pressing of the Virtual Button within the node's editor appear. (The Virtual Button Trigger is provided to allow for debugging Custom Nodes during their development.)
Edge & Embedded Workflows (Overview)
Viewing debug output for an Edge Workflow or an Embedded Workflow is quite different from viewing the output for workflows that execute in Losant's cloud environment. To facilitate this, Losant provides two debugging options:
- A Live Look into a device that displays the version running on the device and connects to the device's debug stream. Live Look is available for all versioned Edge and Embedded workflows.
- An Edge Workflow Test Deployment to a single Edge Compute Device. A test deployment allows for quick testing of an Edge Workflow or an Edge Custom Node by automatically deploying the "develop" version to a single device on every save of the workflow.
Edge & Embedded Workflows (Live Look)
Live Look debugging requires:
- Choosing a specific device ...
- That is currently connected to Losant's MQTT broker ...
- And has a version of the workflow deployed to it.

The Live Look can be accessed through two different methods:
From a Workflow

While viewing a workflow, open the "Devices" tab in the right column to see a list of devices that have a version of the workflow deployed to it (or with a pending deployment). Any device that is connected to the MQTT broker and has a version running will have a "Live Look" option in its dropdown menu. Select this option to launch the Live Look modal for that device, which will allow you to view debug output.
From a Device

You may also view all the workflows deployed to a given device by visiting the "Edge Compute" or "Embedded" tab (depending on the device class) on the device's detail page. This displays a table of all workflows on (or actively deploying to) the device. You may launch the "Live Look" for any workflow on the device, provided the device is connected to the MQTT broker and the desired workflow version has completed deployment.
Edge Workflows (Test Deployment)
Test deployment of the "develop" version is supported for Edge Workflows starting with GEA v1.39.0, and for all GEA versions that support Edge Custom Nodes. Once "develop" is deployed to a device, workflow updates are sent to the device each time the flow is saved. If a named version of the Edge Workflow exists on the device, it must be removed prior to deployment of "develop"; standalone deployments of Edge Custom Nodes is not supported.
The "develop" version of a given workflow or custom node may only be deployed to a single Edge Compute Device at a time. If a new test device is selected, "develop" is removed from the device on which it is currently deployed before deployment to the new device is requested.

Debug Options
In addition to the options for filtering debug output described above, there are additional settings for adjusting which messages appear in the log and how they are displayed by default. Note: These options, and the filtering options described previously, affect only the user viewing the workflow; other users viewing the same workflow are not affected by your chosen settings, and those users are able to apply their own options to the debug panel.

Automatically expand most recent message
When checked, the latest message to appear in the debug panel will expand to display the message body by default. Once a message is no longer the most recent within the panel, the body will collapse unless the user has explicitly collapsed and re-expanded the body already. Uncheck this option to not automatically expand the most recent message.
Expand all properties
When checked, objects within a debug message will display all of their properties and sub-properties all the way down the message's JSON structure by default. If unchecked, only the data property will be expanded to show its sub-properties by default. Note, users may expand or collapse any properties within the panel at any time regardless of this setting.
Enable messages from custom nodes
If your workflow utilizes Custom Nodes, and those Custom Nodes have Debug Nodes within them, checking this option will display the messages produced within those Custom Nodes in the debug panel alongside messages produced by the workflow.
Filter Expression
You may optionally apply an expression to the debug stream to filter the content to only messages returning truthy for the expression. This expression is evaluated against each debug payload generated by the workflow.
For example, to only return debug output for requests from a specific experience user, you could apply an expression:
{{experience.user.email}} === 'mytestuser@exaple.com'
This expression is applied in addition to any output level filtering and individually muted nodes.
Debug Output Levels
By default, all workflow debug messages regardless of their urgency level are displayed within the debug panel. Users may wish to suppress debug messages of one or more of these levels to limit the debug output. Select or deselect the urgency levels you would like to appear in the panel.
Function Node console messages are also subject to these settings; for example, a Function Node with a console.log() statement will not generate a debug message if "Verbose" messages de-selected.
Similarly, Custom Node messages will only appear in the log if the Debug Node within the custom node has an urgency level that is selected as an output option.
Fatal error messages will always appear in the panel regardless of selected output settings.
Note: Updating the debug output levels, muting individual Debug Nodes, and opting in or out of displaying custom node debug output will cause the debug stream to temporarily disconnect and reconnect. Workflows will continue to run during this process but any debug messages were processed while the stream was reconnecting will not appear.
Types of Debug Messages
Debug messages can originate from a number of different sources within a workflow execution, and messages from all of these sources appear together, in chronological order, within the debug panel.
Debug Node Messages
The most common type of message that appears in the debug panel is those generated by Debug Nodes. These are messages the user explicitly opts in to receiving by placing these nodes within the run of a workflow, usually as the very last node at the end of a chain.
Regardless of where it appears in a run or the configuration applied to it, Debug Nodes have no impact on the behavior of a workflow; they do not mutate payload properties, and they take very little time to run (usually no more than 1ms).
You may add as many Debug Nodes to any workflow as you would like. A common practice when developing workflows, for example, is to place Debug Nodes before and after one or more other nodes to view how the execution of those nodes affects the payload.
It is important to look out for the history icon beside the label of an item in your workflow's debug log. The presence of this icon indicates that the log item was generated from a previously saved develop version and does not necessarily reflect what is current for your workflow.

Copying Debug Output
A Debug Node's payload output can be copied to the clipboard by clicking the copy icon in the top right corner of the message's "Payload" tab. This will copy the full JSON output to the device's clipboard, where it can then be pasted into a text editor, a Virtual Button payload, and more.
You may also context-click (e.g. right-click, or click while holding your operating system's modifier key) on any property in the debug output. This will display a dropdown menu with the following options:
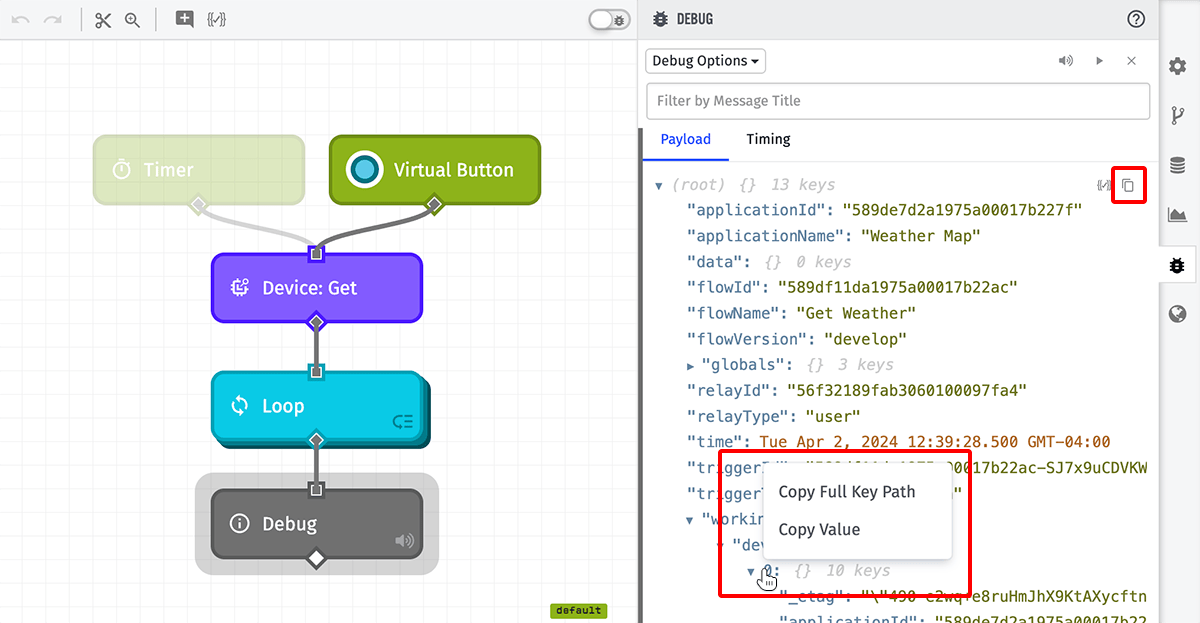
- Copy Full Key Path: This will copy the full payload path of the clicked property to the device's clipboard. This can be useful in development when trying to target a deeply nested property for use in a workflow node's configuration.
- Copy Value: This will copy the value found at the clicked property - including any deeply nested values if the clicked property is an object or array - to the device's clipboard.
Function Node Console Messages
Within a Function Node, you may utilize JavaScript's console.log method to output custom messages or payload values to the workflow debug panel. Those messages will appear in the log as originating from the Function Node instance that produced the message, assuming the level of the console message is being displayed per the selected debug output levels.

Note that other console methods–such as console.time and console.timeEnd–will simply produce debug messages and will not provide the unique behavior of these other methods. They simply behave as the console.log method.
Custom Node Messages
When the "Enable messages from custom nodes" option is enabled, and your workflow makes use of Custom Nodes, and those Custom Nodes produce debug output through their execution, those debug messages will appear in the workflow's debug panel as having originated from the instance of the Custom Node.

Note that a given Custom Node may or may not produce any debug messages; whether a message is produced depends on the content of the custom node itself. Whether a Debug Node from within a Custom Node generates messages in the debug panel is also subject to the chosen debug output levels; as in, a "Verbose" Debug Node in a Custom Node will not generate a message if "Verbose" is not selected as an output level.
Fatal Error Messages
If any node throws an error that causes the workflow to halt execution, those messages will also appear in the debug panel. The messages will outline the encountered error and, like other debug messages, will display the payload as it was at the time of the node's execution.

Workflow-level errors (such as timeouts) will also appear in the debug panel, though per-node timing information may not be available in these cases.
Such errors will also appear in the Workflow Metrics tab, though they may take up to 15 minutes before being reflected in that tab.
Throttle Limit Messages
A workflow will only output a maximum of 10 debug messages per half-second. If that limit is exceeded, the debug stream will publish an additional message to notify the user that the throttle limit has been reached and that some debug messages are not being displayed.

Cases where you may run into debug message throttling include:
- Workflows that run on a very high frequency, such as those kicked off by Device: State Triggers matching a large number of devices that report state several times per minute.
- Workflows that utilize Debug Nodes inside of Loop Nodes. Depending on how long each iteration of the loop takes to execute, you may hit this throttle limit.
- Workflow paths that utilize multiple Debug Nodes in a single run, as these will produce one debug message per node.
- Numerous
console.logmessages within a Function Node.
Debug Stream Status Messages
Upon opening a workflow in your browser, a "Debug stream connected" message will appear in the debug log indicating that the stream has been established with the chosen debug options. If the stream disconnects - which is most likely to happen when changing certain output options or if the browser tab is left idle for a long period of time - a "Debug stream disconnected" message will appear along with the reason for the disconnection.

Shortly after that (assuming the browser has a stable internet connection), another "Debug stream connected" message will appear indicating that debug messages will begin appearing again with the user's applied output settings.
Workflow Node Timing
In addition to displaying the payload at the time a debug message was delivered, each message also contains detailed, per-node execution timing information for all nodes preceding and including the node that triggered the debug message. This is helpful for identifying nodes that take especially long to execute (for example, when interacting with a third-party API using an HTTP Node).
Per-node debug timing is displayed as a waterfall chart under the "Timing" tab of each debug message, with a line dedicated to each node in the execution path. Furthermore, the total elapsed time from the trigger to the message-generating node is also displayed in the header of each debug message.
Loop Node Timing
Loop Nodes are a special case when it comes to workflow node timing:

- For messages generated outside of a loop (such as a Debug Node following a Loop Node), the Loop Node is treated as a single entry in the timing table as if it were any other node in the run, with the total time to execute all iterations of the loop aggregated into one line.
- For messages generated inside of a loop (such as a Debug Node within a loop's contents), message timing is for the individual iteration of the loop that generated the message. In other words, the timing calculation begins with the iteration of the loop and ends at the point where the debug message was generated. Note: Debug Nodes inside of loops can generate a large quantity of messages in a short period of time, which can lead to your debug stream hitting throttling limits.
Note: Embedded Workflows, as well as Edge Workflows running on Gateway Edge Agent v1.23.0 or earlier, do not include workflow node timing data.
Debug Stream Errors
Should a debug stream become disconnected, a disconnection status message will appear in the log and the debug icon will turn red to indicate the problem. In such a case, the workflow will still be executing in response to the triggers contained within, but any debug messages generated by that workflow run will not appear.
Also, messages generated in the stream downtime will not appear in the debug panel after it reconnects. For this reason, the absence of a debug message does not mean that a workflow did not execute when the stream is disconnected or throttled.
Was this page helpful?
Still looking for help? You can also search the Losant Forums or submit your question there.