How To Use Google Maps in Dashboards for Asset Tracking
Generally, you can visualize assets on a map in Losant using the GPS History Block and the GPS Heatmap Block. However, for higher-levels of programmatic customization, you can use the Google Maps Javascript API in the Custom HTML Block, which allow you to create custom maps.

This how-to guide will walk you through visualizing assets on a map using Google Maps in the Custom HTML Block. This guide requires familiarity with HTML, CSS, and JavaScript.
Getting GPS Data
Before you can display assets on a map, you need a device with at least one GPS attribute. GPS attributes are used specifically for tracking the position of resources in the physical world.
Losant provides an Asset Tracking Application Template. It provides a sample application with GPS data that could be used in this guide.
![]()
You can also simulate GPS (and other types) data using the Device Simulator."
Data Queries
To begin, add a Custom HTML Block to a new or existing Dashboard.
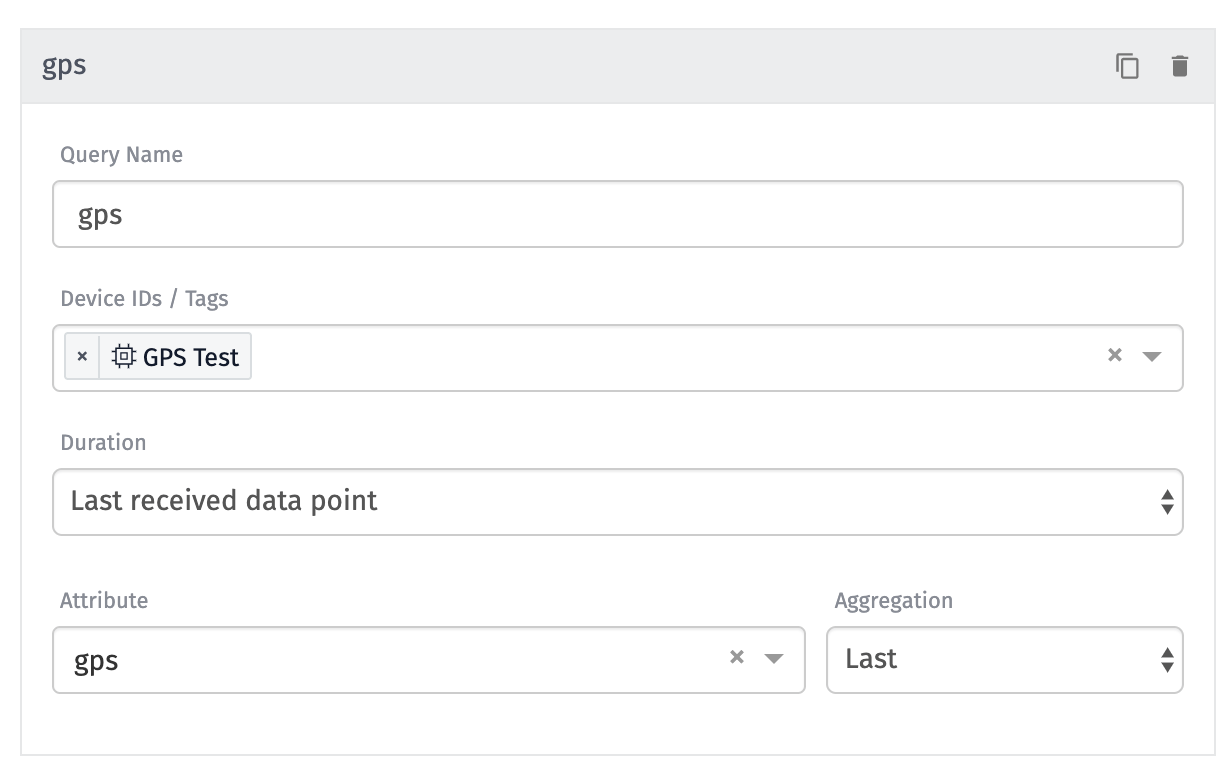
In the Custom HTML Block, you must access data by subscribing to events. You can configure which data to query using the "Queries" configuration:

For this guide, configure the block using a Gauge Query and set the following:
- Query Name: Use
gpsas the query name (This will be used later.) - Device IDs / Tags: For this guide, select one device.
- Duration: Select "Last received data point."
- Attribute: Select a valid GPS Attribute.
- Aggregation: Select "Last."
The above returns a single value of the last received data point of the selected device. After configuration, the Block Input will look like the following:
{
  "size": {
    "width": 390.844,
    "height": 290
  },
  "dashboard": {
    "theme": "light",
    "time": 1593385788532
  },
  "ctx": {},
  "queries": {
    "gps": {
      "time": "2020-06-28T23:09:35.000Z",
      "value": "39.798,-86.045"
    }
  }
}
At queries.gps.value, you can find the device’s GPS data. Now, you can display it on a map.
Configuring the Custom HTML Page
In the Custom HTML Block, you must define the HTML, JavaScript, and CSS content that makes up the head and body of your page and describe how to visualize your query data using JavaScript.
Custom Head Content
In the "Custom Head Content", copy and paste the following:
<title>Simple Map</title>
<meta name="viewport" content="initial-scale=1.0" />
<meta charset="utf-8" />
<style>
  /* Always set the map height explicitly to define the size of the div
   * element that contains the map. */
  #map {
    height: 100%;
  }
  /* Optional: Makes the sample page fill the window. */
  html,
  body {
    height: 100%;
    margin: 0;
    padding: 0;
  }
</style>
Here, we can leverage HTML and CSS--they allow custom layouts and styling the Custom HTML block. Feel free to change as desired.
Custom Body Content
In the "Custom Body Content", copy/paste the following:
<div id="map"></div>
<script>
  var map
  function initMap() {
    var drawChart = function() {
      if (!DashboardBlock.input.queries.gps) {
        console.log("The value at DashboardBlock.input.queries.gps not found")
        return
      }
      // values come back as a String in the format of  "lat,lng"
      var gps = DashboardBlock.input.queries.gps.value.split(',')
      var latLng = { lat: parseFloat(gps[0]), lng: parseFloat(gps[1]) }

      map = new google.maps.Map(document.getElementById('map'), {
        center: latLng,
        zoom: 7,
      })
      var marker = new google.maps.Marker({
        position: latLng,
        map: map,
        title: 'Hello World!',
      })
    }
    DashboardBlock.on('change', drawChart)
  }
</script>
<script
  src="https://maps.googleapis.com/maps/api/js?key=GOOGLE_API_KEY&callback=initMap"
  async
  defer
></script>
The snippet above loads the Google Maps JavaScript library, reads the GPS value, places the GPS value on the Google Map, and keeps it updated with the Dashboard refreshes. To help explain what's going on, let's walk through the snippet above a couple of lines at a time.
Body Content Walkthrough
Here we can set up a div HTML element with the id of map for the Google Map:
<div id="map"></div>
Then, we can load the Google Maps JavaScript library with the following:
<script>
  var map
  function initMap() {
    ...
  }
</script>
<script
  src="https://maps.googleapis.com/maps/api/js?key=GOOGLE_API_KEY&callback=initMap"
  async
  defer
></script>
In the URL, configure the key and callback. In the URL, the callback is set to initMap. This will call the function initMap when the map is loaded.
To configure a proper key, you must get an API key from the Google Maps Console.
Next, we can dig in to the initMap function. It's structured like so:
var drawChart = function() {
  ...
}
DashboardBlock.on('change', drawChart)
DashboardBlock is a special event emitter that we can use to listen to Dashboard changes. Every time the change event is fired, the drawChart function will be called. You may see the other available events in the Custom HTML Block documentation.
Google Maps expects an object that represents GPS data that is similar to the following:
{ lat: -34.397, lng: 150.644 }
We can access the GPS value at DashboardBlock.input.queries.gps.value and create the proper GPS object for Google Maps:
// values come back as a String in the format of  "lat,lng"
var gps = DashboardBlock.input.queries.gps.value.split(',')
var latLng = { lat: parseInt(gps[0]), lng: parseInt(gps[1]) }
From above, we now have a proper GPS object at latLng. Next, we can use it to configure the map:
map = new google.maps.Map(document.getElementById('map'), {
  center: latLng,
  zoom: 7,
})
var marker = new google.maps.Marker({
  position: latLng,
  map: map,
  title: 'Hello World!',
})
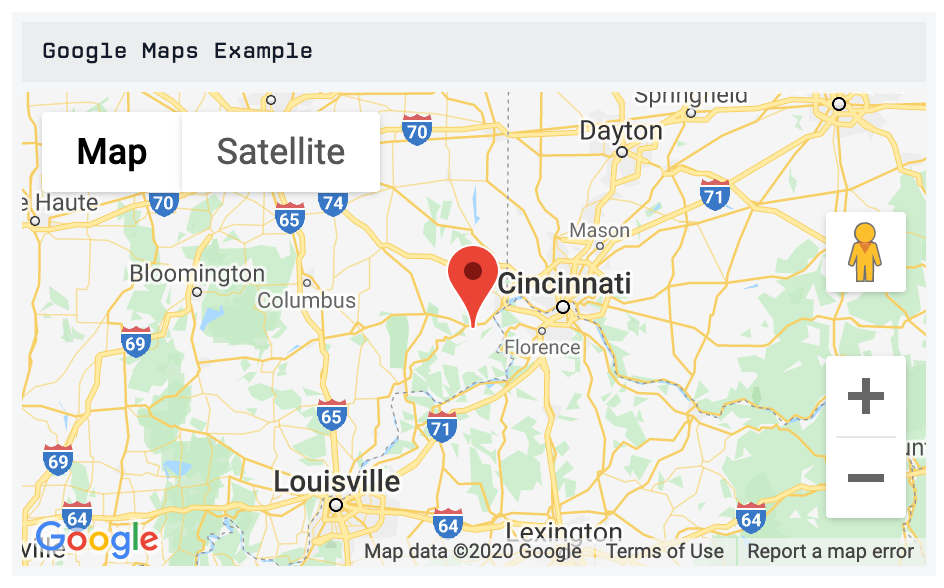
Once done, you will have a block that visualizes assets in a Losant Dashboard using Google Maps.

To explore what's possible with Google Maps, see Google Maps Examples.
Was this page helpful?
Still looking for help? You can also search the Losant Forums or submit your question there.