Image Overlay
The Image Overlay Block allows you to display a series of overlays atop a background image of your choosing. This allows for creating visualizations of your physical systems in a SCADA-style display.
Block Configuration
The block's configuration is broken up into three sections:
Image Background
First, define the background against which your overlays will be displayed using the following properties:
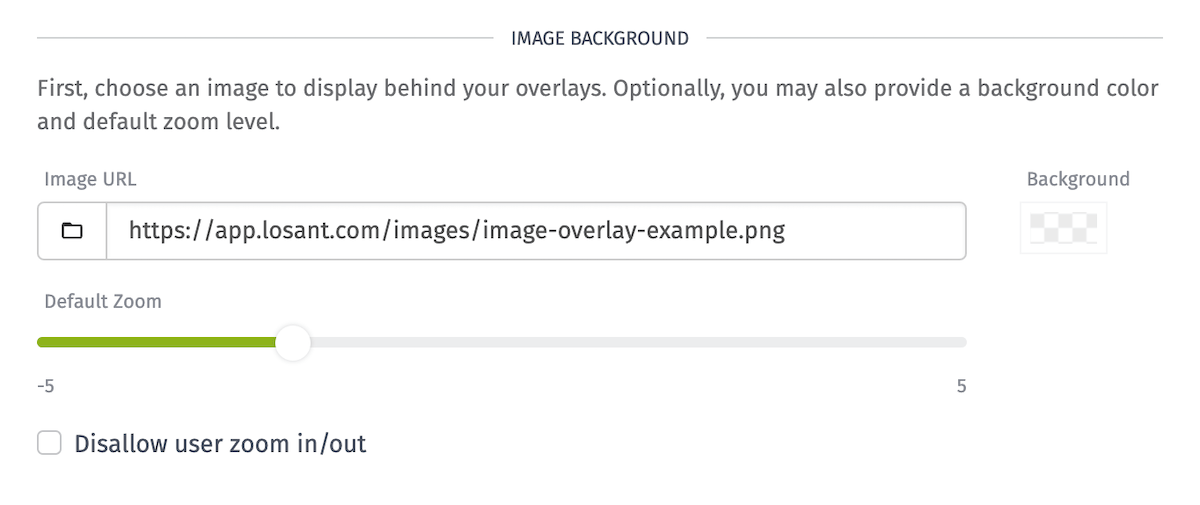
- Image Background: Provide a URL to one of your Application Files or to a publicly accessible URL. The field supports string templates, so you can dynamically change the image based on dashboard context.
- Background Color: Choose a color to display behind the image. By default this is transparent, which will show the background of the dashboard block. That color changes depending on your current dashboard theme.
- Default Zoom: By default, the image background will display at its natural size. Use this slider to zoom in or out when the block first loads. Users may change the image's zoom within the block after its initial display.
- Disallow user zoom in/out: When checked, the zoom controls will not appear on the block and users viewing the block will not be able to alter the zoom level.
Queries
Next, define a set of data queries whose resolved values will be used to back the overlays you apply to the block. While these are optional, in almost all cases you will build at least one query when configuring an Image Overlay Block.
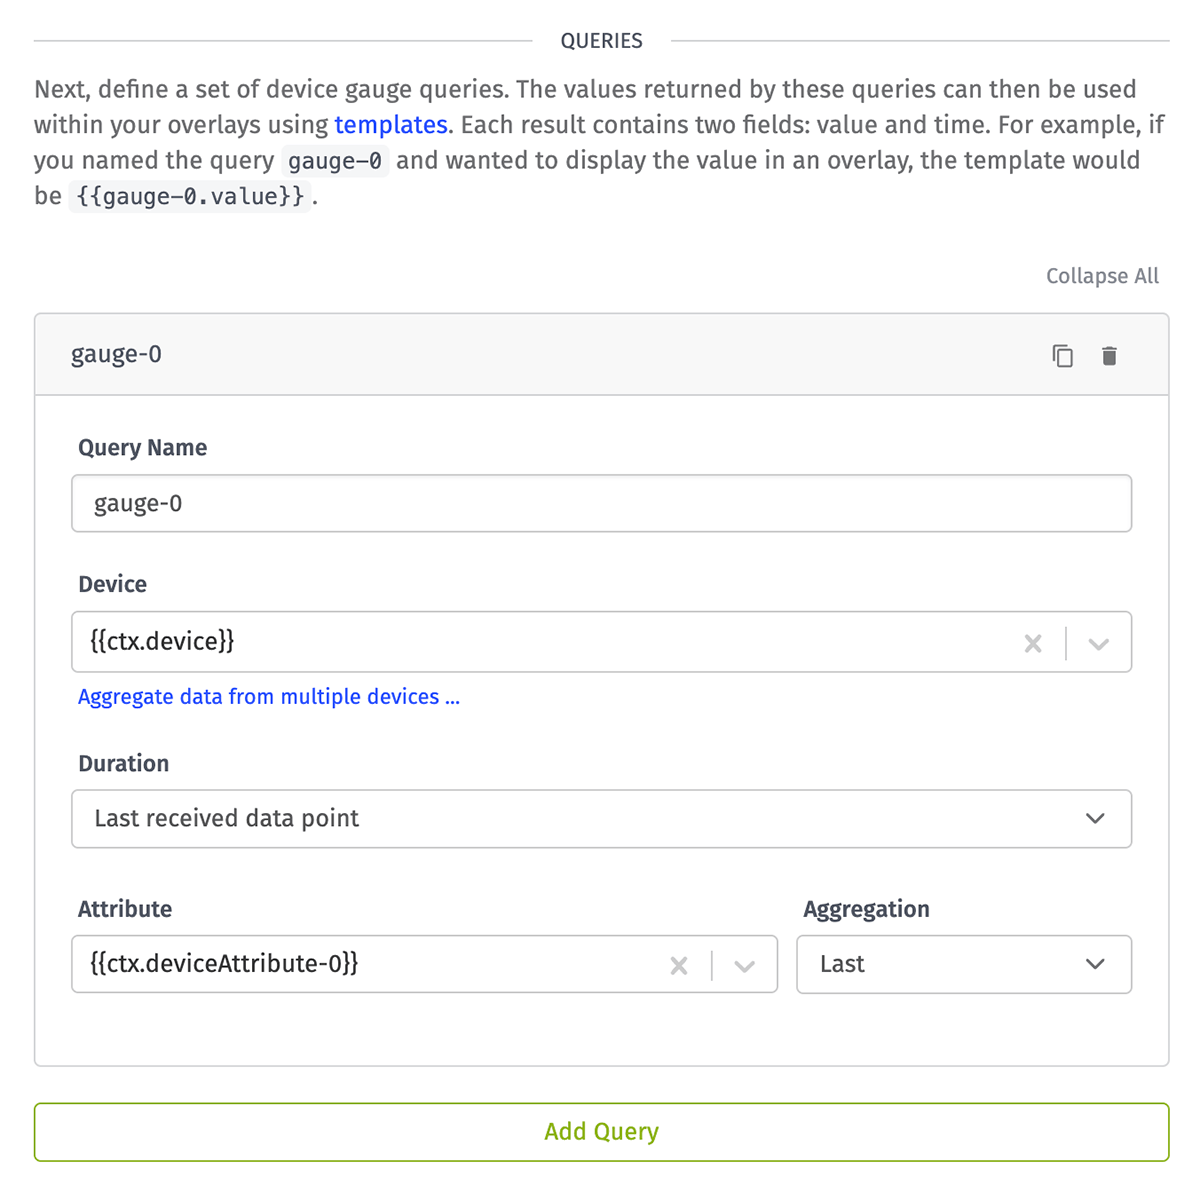
Click the "Add Query" button to add a new query to the block. You may also clone a query by clicking the "Clone" icon in its header, and queries can also be removed from the block by clicking the "Delete" icon in the query header.
Each query takes the following properties:
- Query Name is how you will reference the returned result of the query within your overlay configuration. The query name may only contain uppercase and lowercase letters; numbers; and underscores (_) and hyphens (-). Query names must be unique within the block.
- Device is a device query for choosing which device(s) to return aggregated data for.
- Duration is how far into the past you want to query for data. This defaults to the last received data point (relative to the dashboard end time).
- Attribute is the device attribute whose value will be returned in the query. Note that if data from more than one device is being displayed, each of those devices must supply the same attribute name.
- Aggregation determines how all the available data returned should be aggregated before being returned. This defaults to "Last".
Overlays
Finally, create a set of overlays to display within the block. There are multiple types of overlays, each with some unique configuration properties as outlined below.
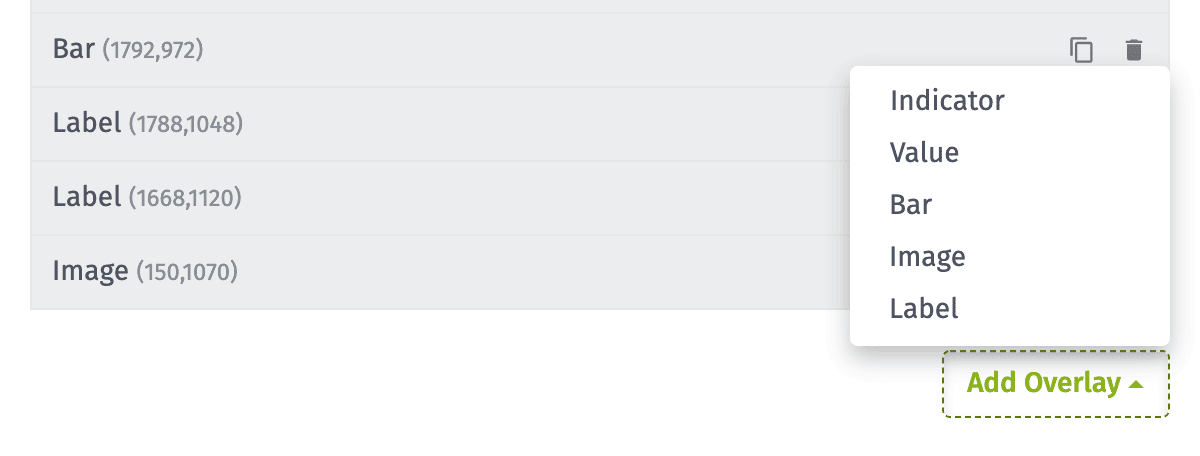
To add an overlay to the block, click the "Add Overlay" button and choose the type to add from the menu.
Regardless of type, each overlay takes the following common properties:
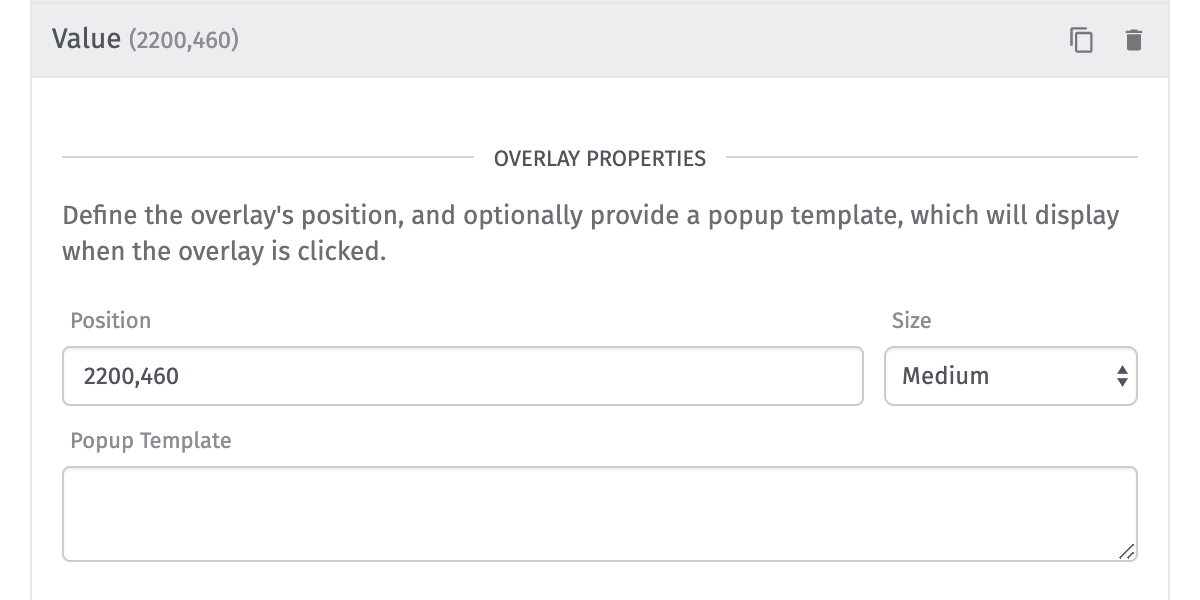
- Position: This is the
x,ylocation of the overlay atop your chosen image, where0,0is the image's top left corner and positive numbers travel right and down respectively. While it is possible to manually enter a location for the overlay, you may also drag the overlays to their desired position within the block preview to set this value. - Size: Choose whether to display a
Small,Medium(default), orLargeoverlay. Depending on the overlay type, this option manifests in different ways. - Popup Template: Optionally, each overlay can display a popup when clicked. The content is rendered as Markdown, and the following variables are available within the field:
{{QUERY_NAME.value}}: The returned result from one of your defined queries{{QUERY_NAME.time}}: The time associated with the query's value{{ctx.VARIABLE_NAME}}: The current value of any of your dashboard's context variables{{block.width}}: The rendered width of the block in pixels{{block.height}}: The rendered height of the block in pixels{{block.theme}}: The current dashboard theme ("light" or "dark")
There are multiple types of overlays, each of which takes a unique set of configuration properties and which displays differently within the block. Some of these properties can be changed conditionally.
Indicators display a simple icon with a color of your choosing.
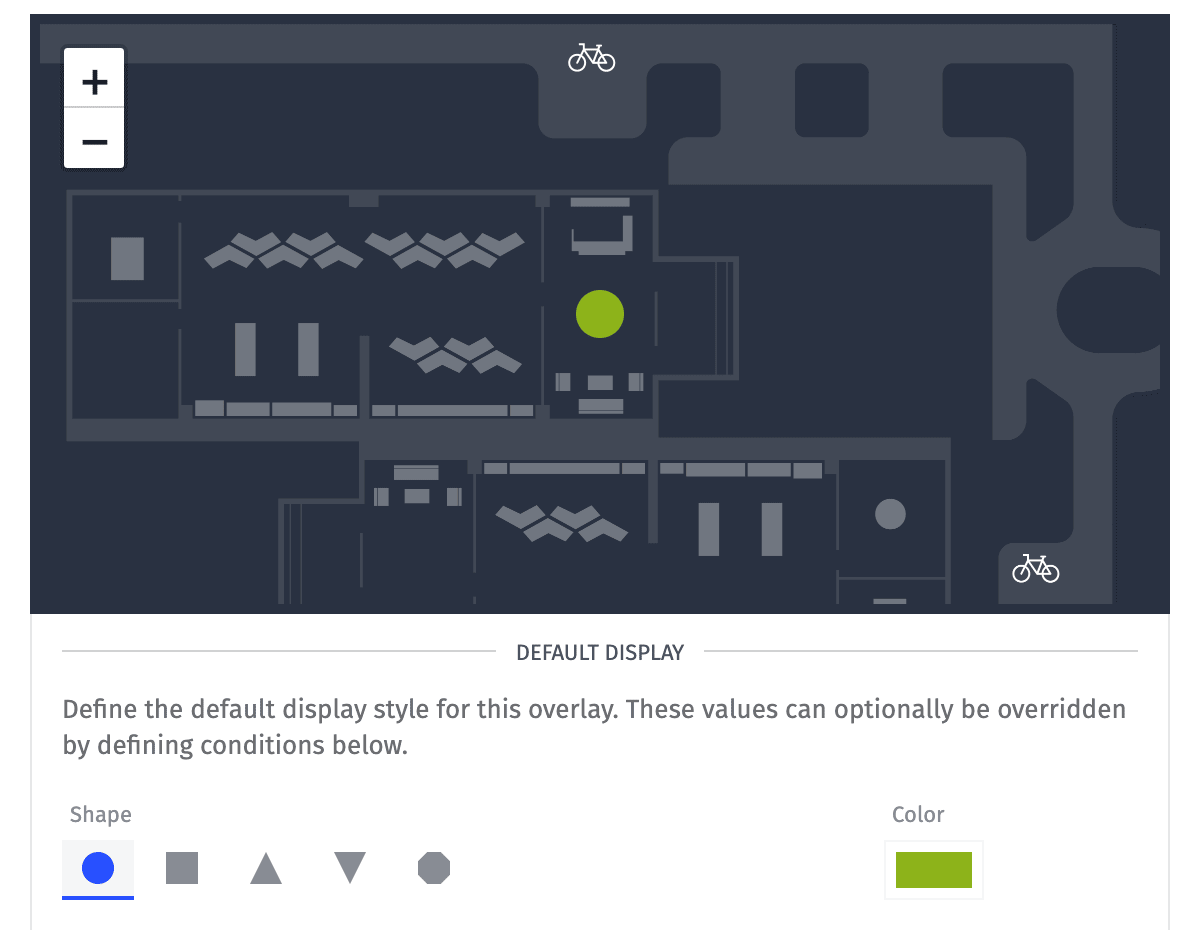
The overlay takes two properties that can be changed conditionally:
- Shape: Whether the indicator should render as a circle, square, upwards-pointing triangle, downwards-pointing triangle, or octagon
- Color: The fill color of the chosen indicator shape
Values display a rendered query value against a background color of your choosing. The text color automatically switches between light and dark depending on the overlay's background.
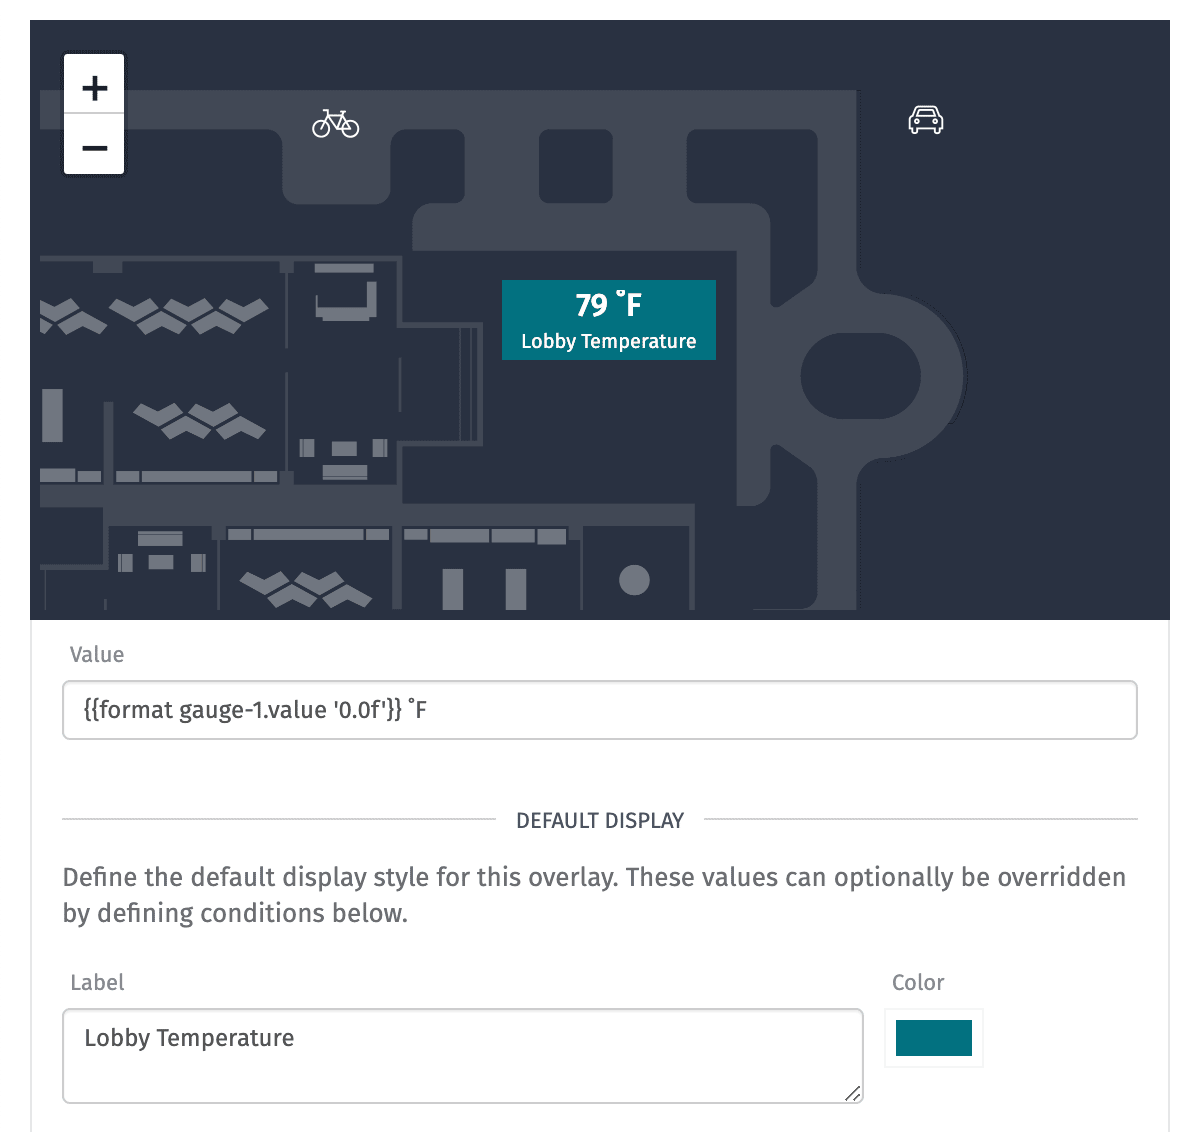
In addition to its conditional properties, the overlay requires one additional setting:
- Value: A string template for rendering the content of the overlay
Conditionally, the following properties can also change:
- Label: An optional string template to display beneath the rendered value
- Color: The background color against which the value and label defined above is displayed
Bars display a simple bar graph atop your background image. The bar's fill level can then increase or decrease as its rendered value changes.
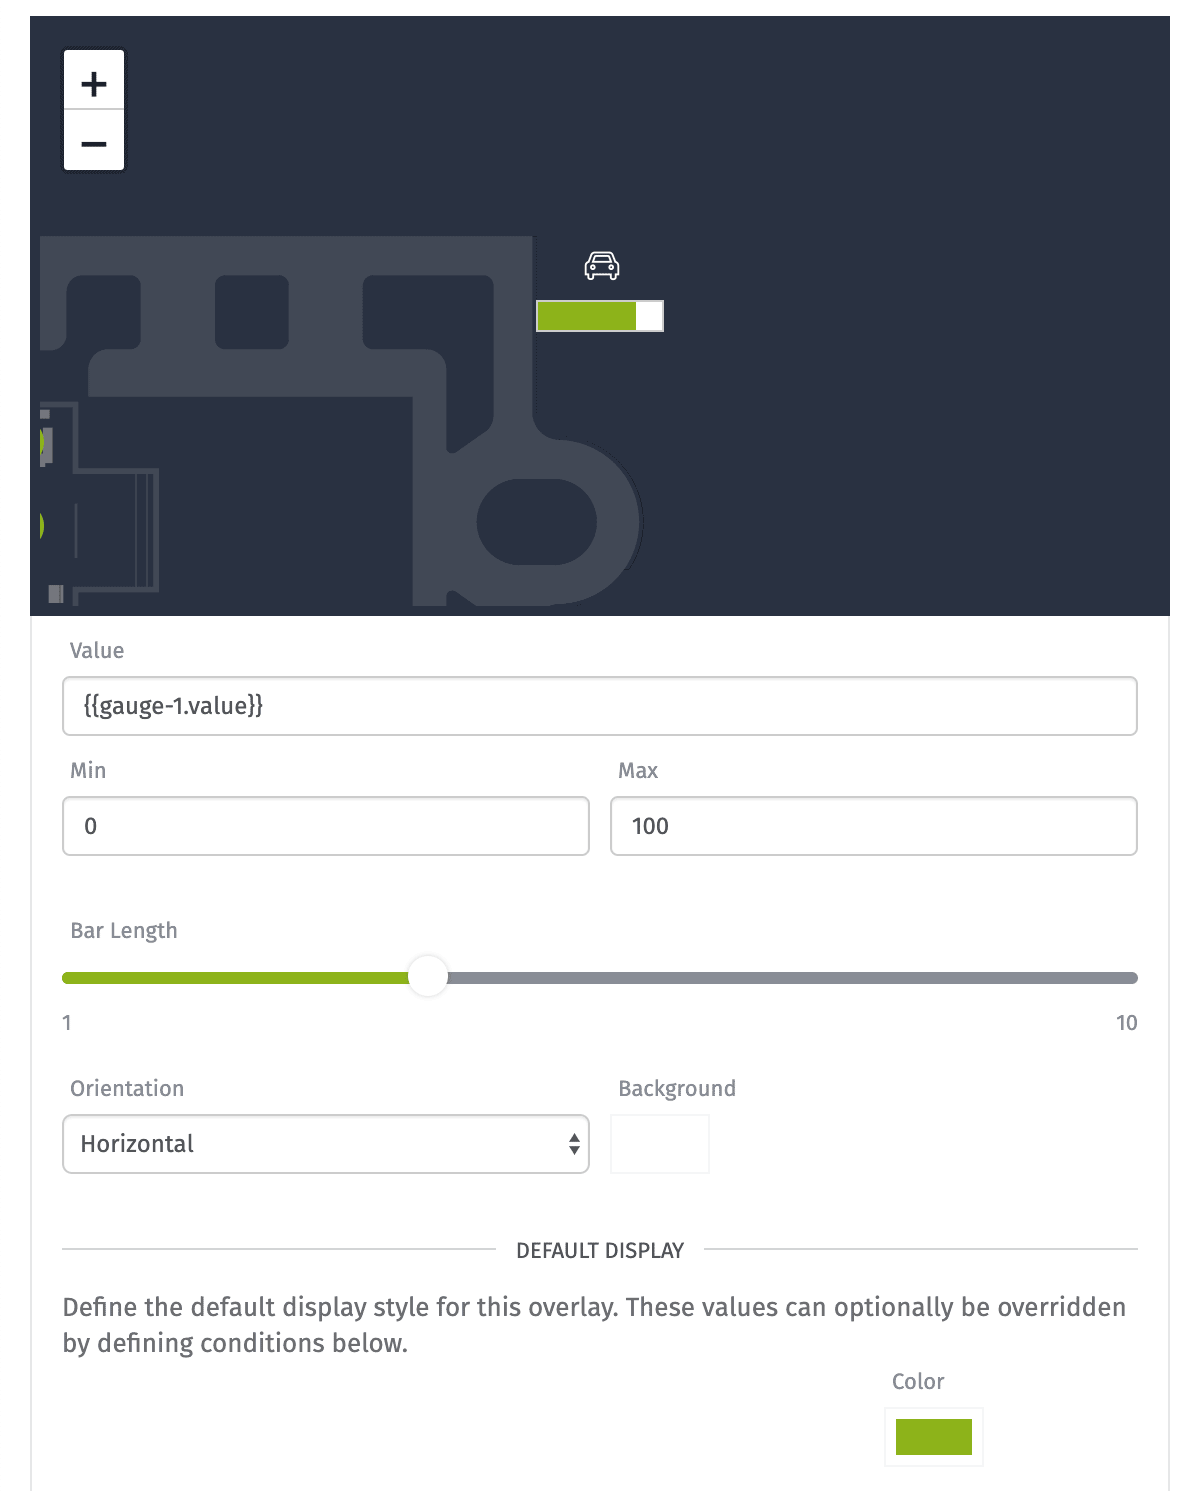
The overlay requires the following additional properties:
- Value: A string template for rendering the bar's fill level. This value should always resolve to a number, or the bar will fail to fill.
- Min: Combined with a max value, this string template is used to calculate the bar's fill level from its defined value. This must resolve to a number less than the overlay's "Max".
- Max: Combined with a min value, this string template is used to calculate the bar's fill level from its defined value. This must resolve to a number greater than the overlay's "Min".
- Bar Length: Independent of the overlay's size, this can be used to lengthen or shorten the bar.
- Orientation: This changes whether the bar fills vertically or horizontally (default).
- Background: This is the color that displays within the unfilled portion of the bar (default is white).
Only one bar property can be changed conditionally:
- Color: The fill color of the bar
Images display a graphic from your Application Files, from a data URL, or from a publicly accessible URL.
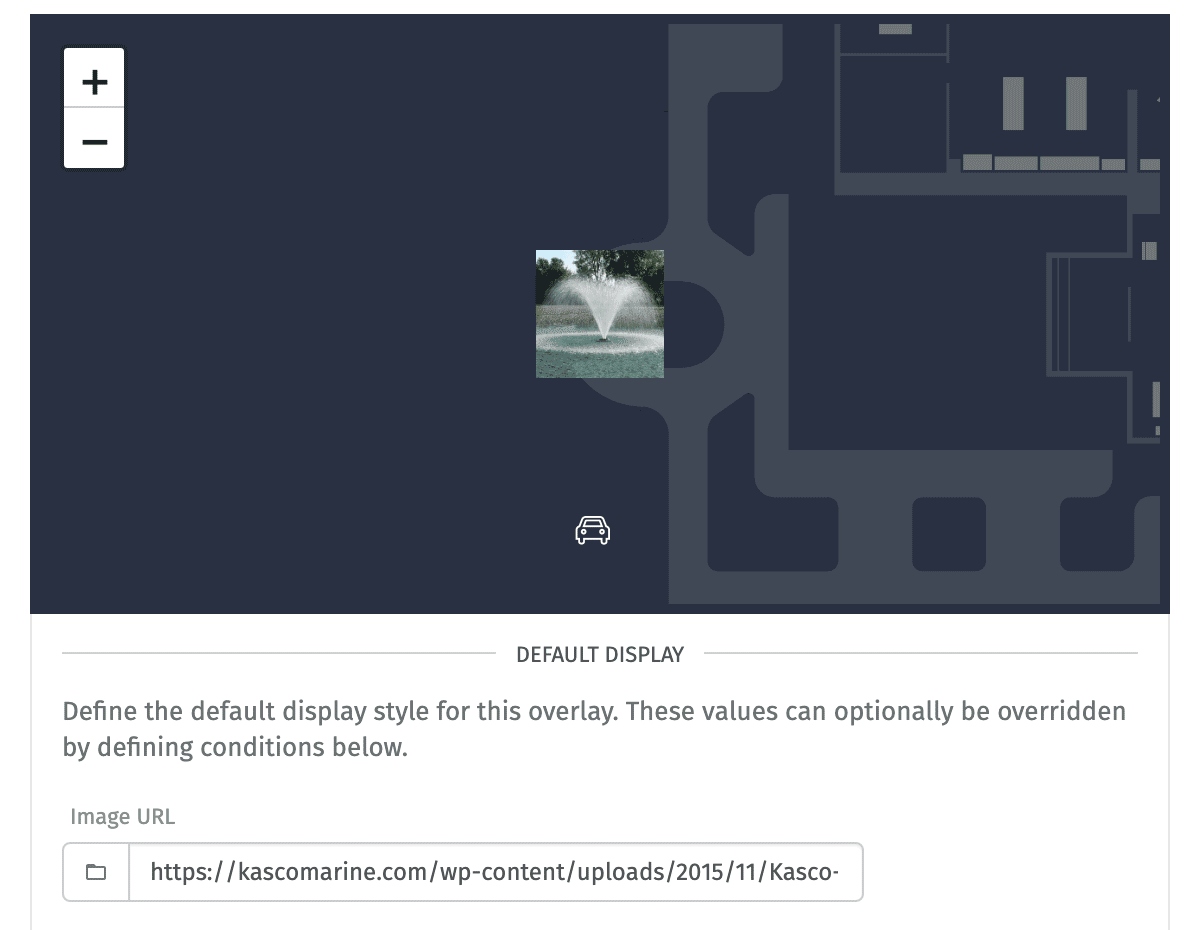
The overlay only takes one conditional property:
- Image URL: The URL of the image to display
Labels render a string of text directly on your image overlay.
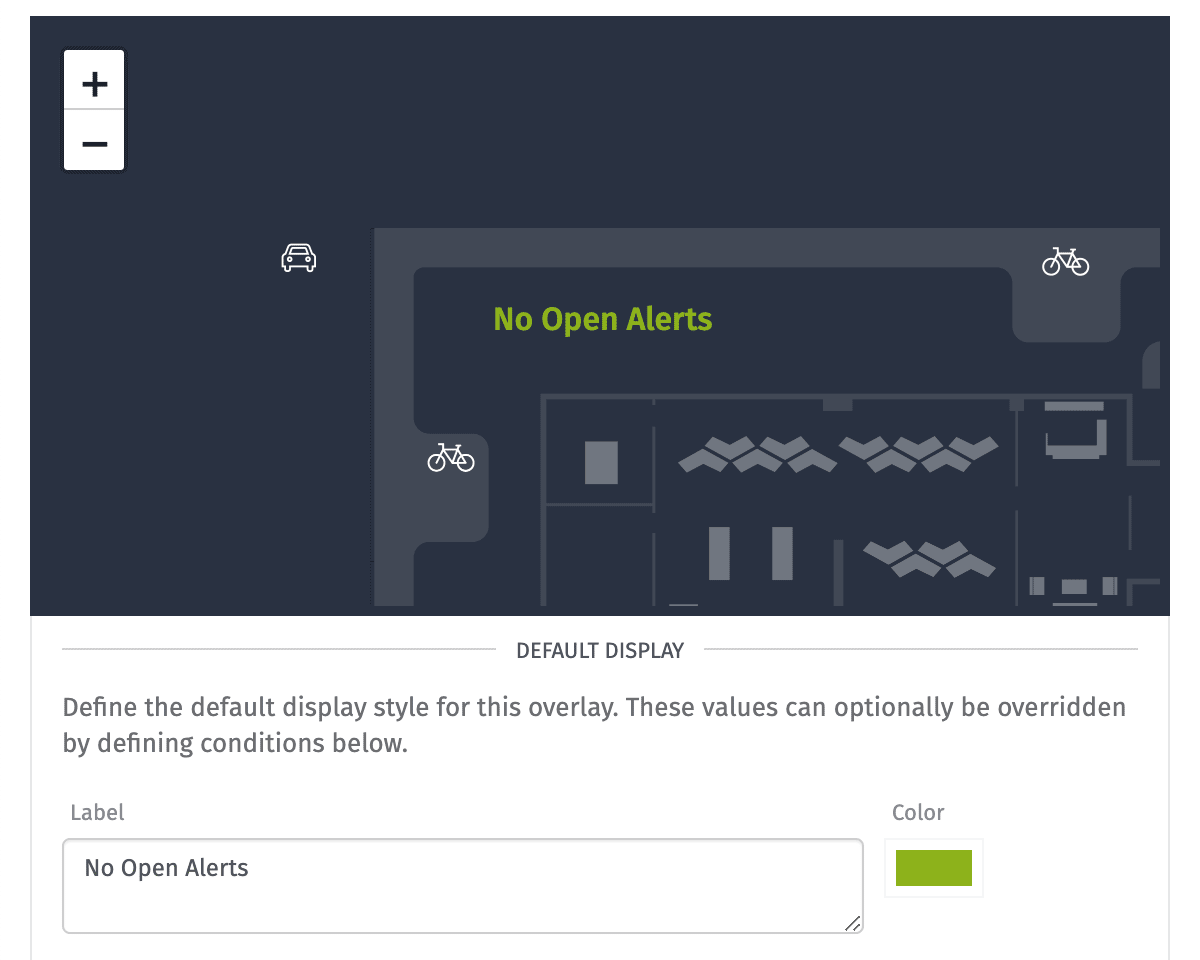
The overlay takes two conditional properties:
- Label: A string template for the text to place atop the overlay
- Color: The color of the rendered text
Overlay Conditions
Each overlay type has specific properties that can be changed given a series of expressions you define. To add a condition, click the "Add Condition" button within the overlay to which you would like to add it. A condition can be deleted by clicking the "Delete" icon within its header.
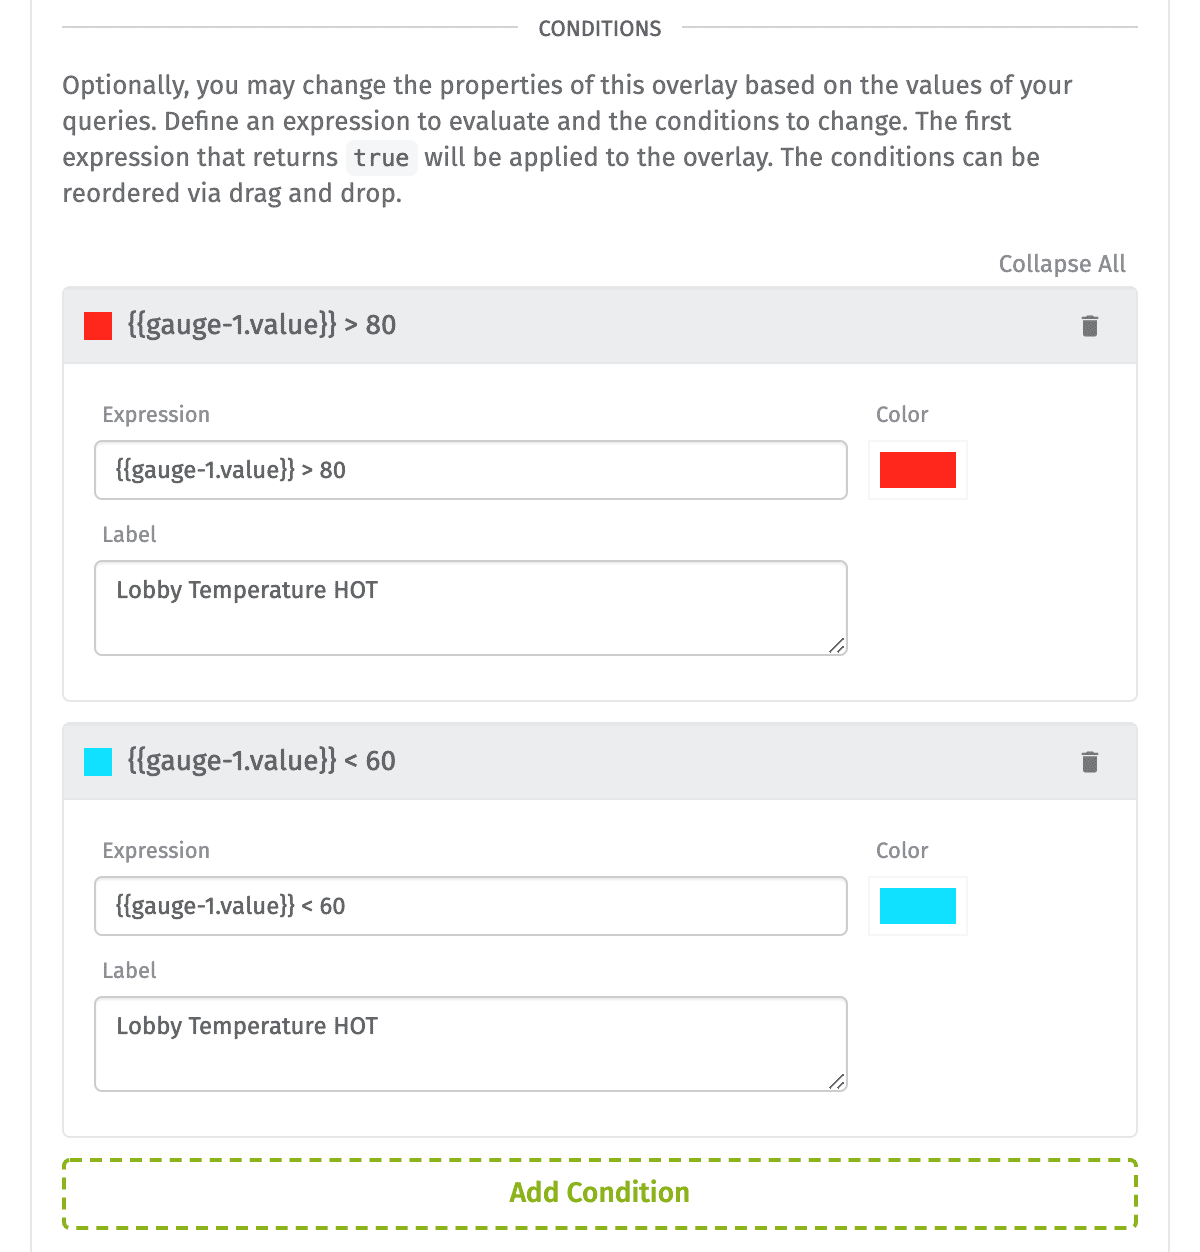
The conditions can be rearranged by via drag-and-drop. The order of the conditions is extremely important as the first condition whose expression returns true will have its display properties applied to the overlay.
Block Examples
An Image Overlay Block is best used for two different purposes, though it can certainly be applied to other application scenarios.
Smart Environment
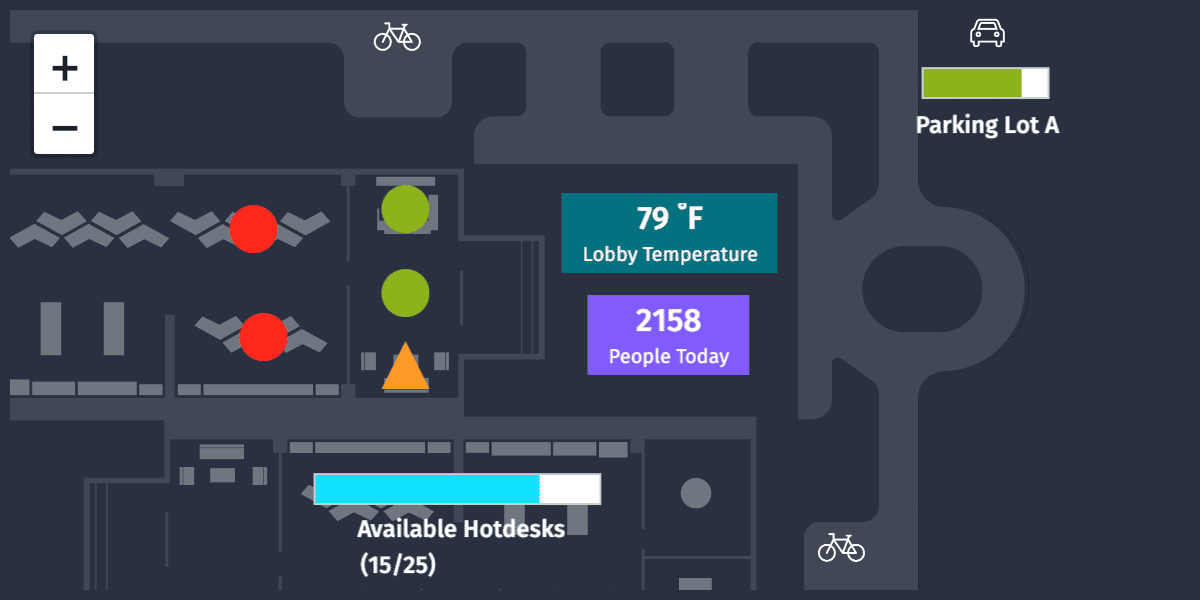
In the example within this page, the block is being used to visualize the properties of a smart environment. There are overlays to indicate:
- Occupancy status of conference rooms
- Availability of seating on the main office floor (assuming a "hot desk" setup)
- Number of spots available in the building's parking garage
- Temperature of specific areas of the environment
- Amount of foot traffic the environment has seen today

By overlaying these values atop a blueprint of the physical environment, a building administrator can very quickly and easily gain insight into the environment and address any immediate needs.
SCADA Visualization
SCADA charts (Supervisory Control And Data Acquisition) are often used in industrial settings to get a realtime view into the status of a system. These charts often have:
- Indicators to tell whether valves are open, power is provided to a machine, or systems are in a healthy state
- Values representing numerical data such as water temperature, pipe pressure, or the count of items to come through a manufacturing line
- Bars indicating the fill level of tanks against their maximum volume
Related Blocks
Was this page helpful?
Still looking for help? You can also search the Losant Forums or submit your question there.