Gauge
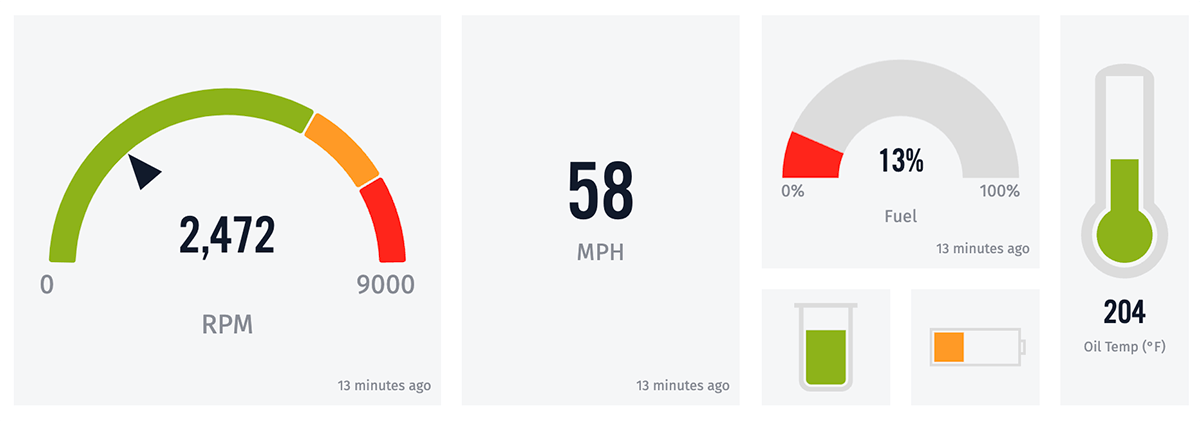
The Gauge Block displays a single attribute value, either as a number or as a visual representation in one of many different styles.

Configuration
Settings for the Gauge Block are broken up into several sections.
Data Type

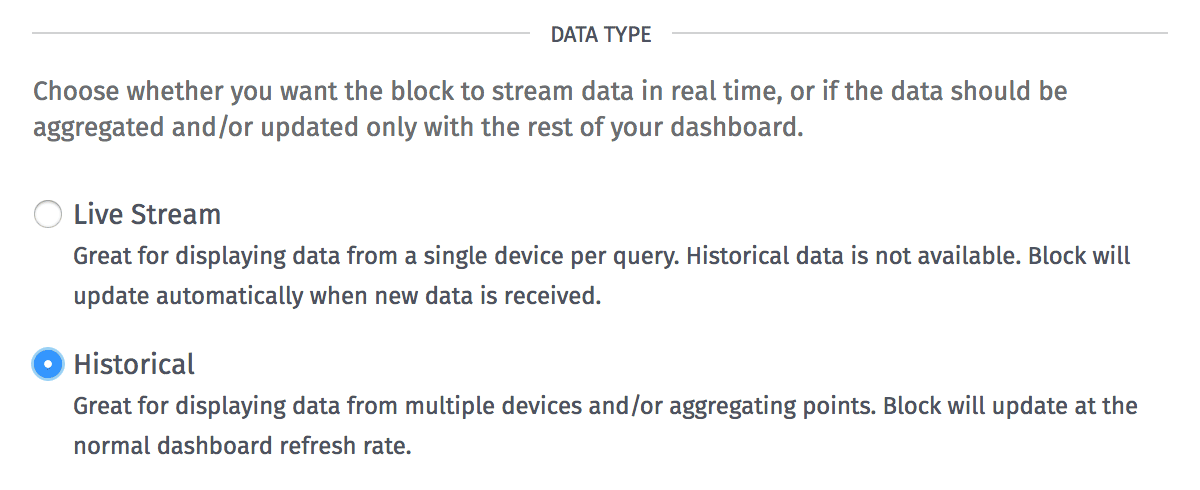
The gauge block can display points as a live stream - rendering a new value every time a data point comes in for your chosen device(s) and attribute - or as a historical gauge. Each style has its own advantages:
- Live Stream: Provides feedback with more immediacy than historical gauges, as they do not require a dashboard data refresh to populate with new data. If the gauge's data query references multiple devices by ID or tag, the gauge updates any time any of the devices reports state for the chosen attribute.
- Historical: Aggregates data according to a number of rules (based on time durations, mathematical functions, and the combination of data from multiple sources), and allows for viewing past dashboard states.
Duration
When Data Type is set to "Historical", you must also choose a duration (time range) from which to pull data for the gauge. To view current state of your device(s), select "Last received data point". To view an aggregation of your data over a given time period, choose any other value.

When "Live Stream" is selected as the Data Type, this section is not applicable and is hidden.
Block Data
The block data specifies the source of the raw value to render within the gauge. It takes three parameters:

- Device: Choose a device from which to pull data from the block. If you wish to aggregate data from multiple devices, you may instead define a device query. This may reference device ID, device tag, or experience user context variables.
- Attribute: Select a single attribute from your device(s) whose value should be displayed in the gauge. Depending on the block's other settings, this may be limited to just number-type attributes. This may reference device attribute context variables.
- Aggregation: Choose an aggregation method for reducing the returned data to a single data point for use within the block. Depending on the block's other settings, certain methods may not be selectable, or the aggregation may not be applicable and the input will be disabled.
Gauge Style
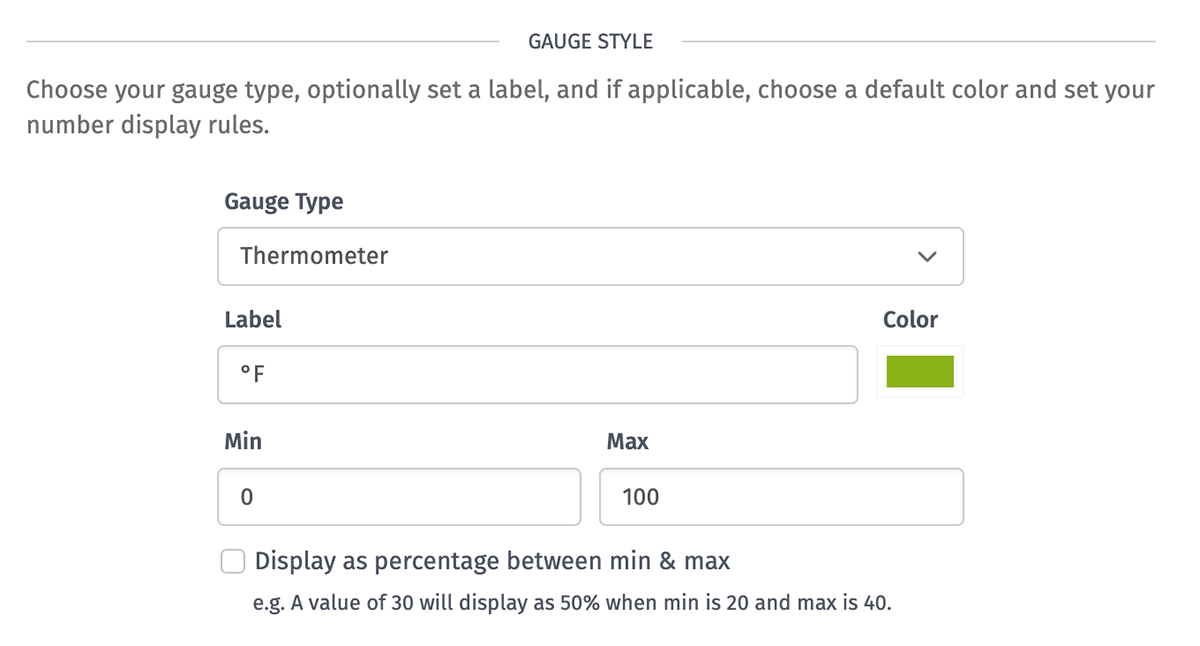
Next, choose the type of gauge to display and its additional configuration options ...

- Gauge Type: Choose one of the six available types ...
- Number displays a value as a single number.
- Dial displays the value along with a filled semicircular dial.
- Battery displays the value along with a filled horizontal battery.
- Thermometer displays the value along with a filled vertical thermometer.
- Tank displays the value along with a filled vertical tank.
- Needle displays the value along with a needle pointing to a color-banded arc.
- Label: The text displayed beneath the gauge. This is templatable from your dashboard context, and the label supports limited Markdown. If not provided, no label is visible beneath the gauge.
When any Gauge Type other than "Number" is selected, additional configuration options become available:
- Color: The default color of the gauge's fill section. This can be conditionally overridden based on the gauge's value. (Color is not applicable for "Needle" gauge types.)
- Min: The lower boundary of the gauge's fill area. This value must be a string template or a number less than Max.
- Max: The upper boundary of the gauge's fill area. This value must be a string template or a number greater than Min.
- Display as percentage between min & max: Optionally, choose to display the gauge's min and max boundaries and value as percentages instead of raw numbers.
Min and Max are templatable from your dashboard's number-type context; when using templates, if the resolved value(s) causes the Min to be greater than the Max, the gauge will revert to a Min of 0 and a Max of 100.
Values that go above or below the resolved Min or Max will continue to display in the gauge, but the gauge itself will either be empty or full, depending on if the value falls below the Min or exceeds the Max, respectively.
Number Display Rules
The value displayed in the gauge can be rounded or represented a few different ways, and depending on the value being returned by your devices, these rules can greatly enhance the usability of the gauge block when dealing with very large or very small numbers.
- For the Precision Type, choose Significant Digits (default) to round the value based on the number of digits selected. To always display a certain number of decimal points, choose Floating Point.
- For the Digits, enter any integer greater than 0. This number will be applied to the Precision Type previously selected. Default is 4.
For example, say you have a gauge displaying the current outside temperate. The actual number reported by the device is 64.67. Here is how different number display rules would represent that number:
| 1 | 2 | 3 | 4 | |
|---|---|---|---|---|
| Significant Digits | 6e+1 | 65 | 64.7 | 64.67 |
| Floating Point | 64.7 | 64.67 | 64.670 | 64.6700 |
Data Transformation
Optionally, you may apply an expression the block's data point. You have access to the following variables when evaluating the expression:
{{value}}: The raw value of the data point.{{time}}: The time of the corresponding data point in milliseconds since Epoch.{{ctx.VARIABLE_NAME}}: The value of a given context variable.
For example, given a temperature value that is reported in Kelvin units but that you would like to display in Fahrenheit, provide the following expression:
The expression is applied to the value returned by the query, and the resolved value is what is provided to the gauge for display. If an invalid expression is provided, the data point reverts to its raw value.
Conditional Gauge Colors
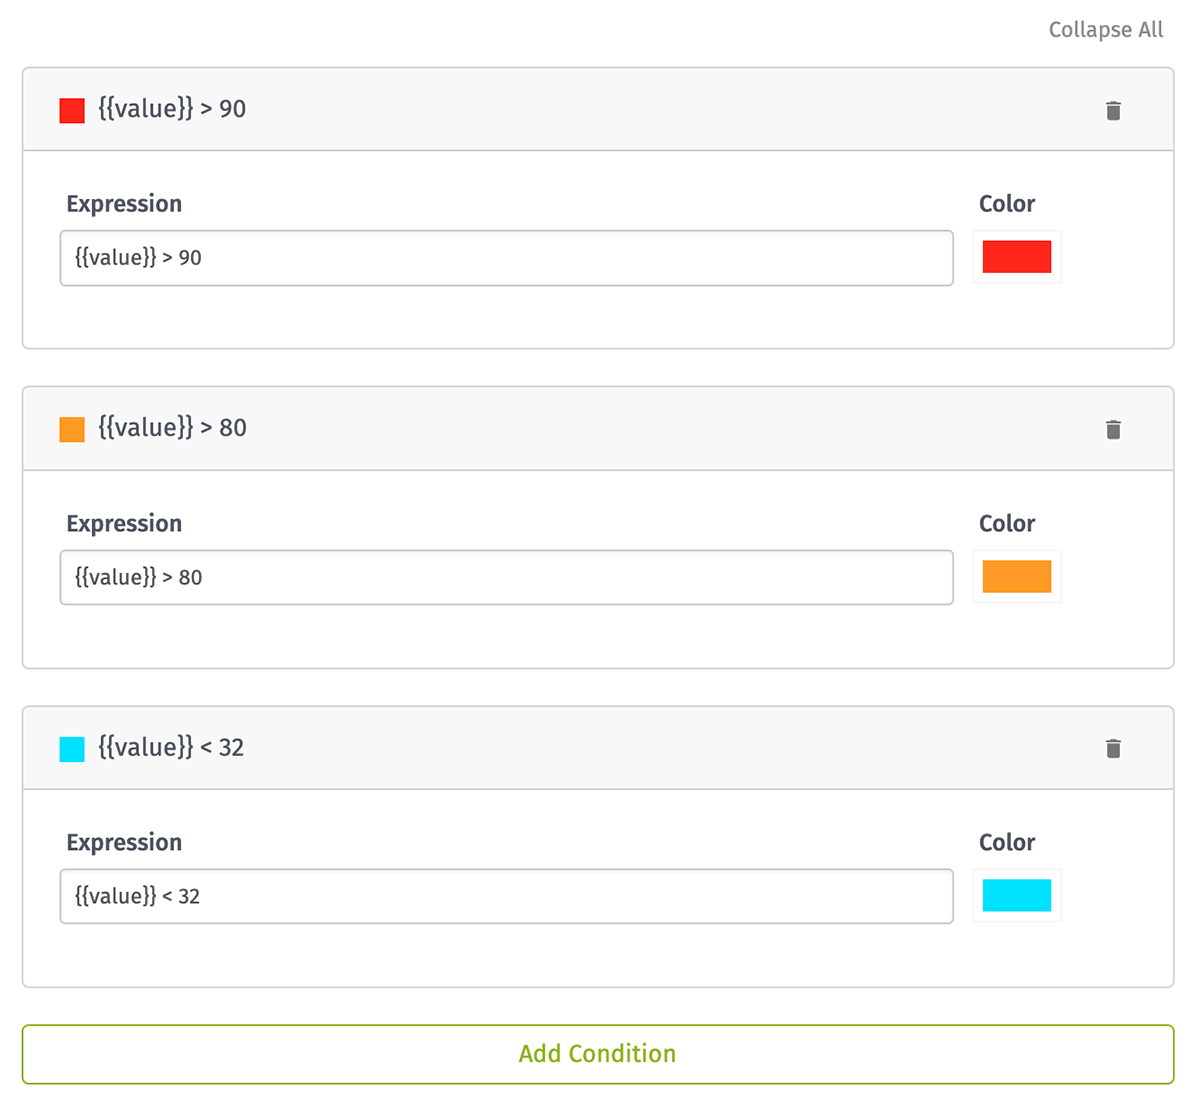
If the Gauge Type is set to anything but "Number" or "Needle", you may optionally create a list of conditions that change the color of the gauge depending on the query's returned value. This works similarly to the Indicator Block, in that the first expression that returns truthy determines the gauge's color. If none of them return truthy, the default color set in the Gauge Style will be the gauge's color.

The conditions can be arranged via drag-and-drop to set their priority relative to one another. The following variables are available when writing the expressions:
{{value}}: The result of the query's data transformation expression if one is applied; if not, the raw numeric value returned from the query.{{percent}}: The percentage that{{value}}represents when compared against the minimum and maximum values set in the dial gauge configuration. For example, given a minimum of 10 and a maximum of 50, when{{value}}is equal to 40, the corresponding{{percent}}is 75.{{ctx.VARIABLE_NAME}}: The value of a given context variable.
Needle Arc Ranges
For "Needle" gauges, you may optionally define color ranges for the sections of the arc (akin to "OK", "Warning", and "Danger" levels in a real-world gauge). For each arc, you must provide ...
- Arc Max: An expression that resolves to a number for the maximum limit of the arc. The resolved Arc Max must be ...
- Greater than the previous Arc Max, if applicable.
- Greater than the gauge's Min.
- Less than or equal to the gauge's Max.
- Color: The color for this section of the arc.

Each Arc Max is templatable, with the following values available as context:
{{ctx.VARIABLE_NAME}}- Value of a given context variable.{{gauge.min}}- Resolved minimum gauge value.{{gauge.max}}- Resolved maximum gauge value.{{gauge.range}}- Equal to{{gauge.max}} - {{gauge.min}}.
If any Arc Max resolves to an invalid value, the arcs revert to an uncolored state.
Was this page helpful?
Still looking for help? You can also search the Losant Forums or submit your question there.