Custom Chart
The Custom Chart Block is an advanced Block that allows you to create custom data visualization by utilizing your choice of Vega or Vega-Lite.
If you would like a specific visualization that's not already a Losant Dashboard Block, the Custom Chart Block supports a wide array of visualization types like Scatterplots, Bubble Plots, or even layer visualizations together.
Configuring the Custom Chart Block is broken up into two sections:
Queries
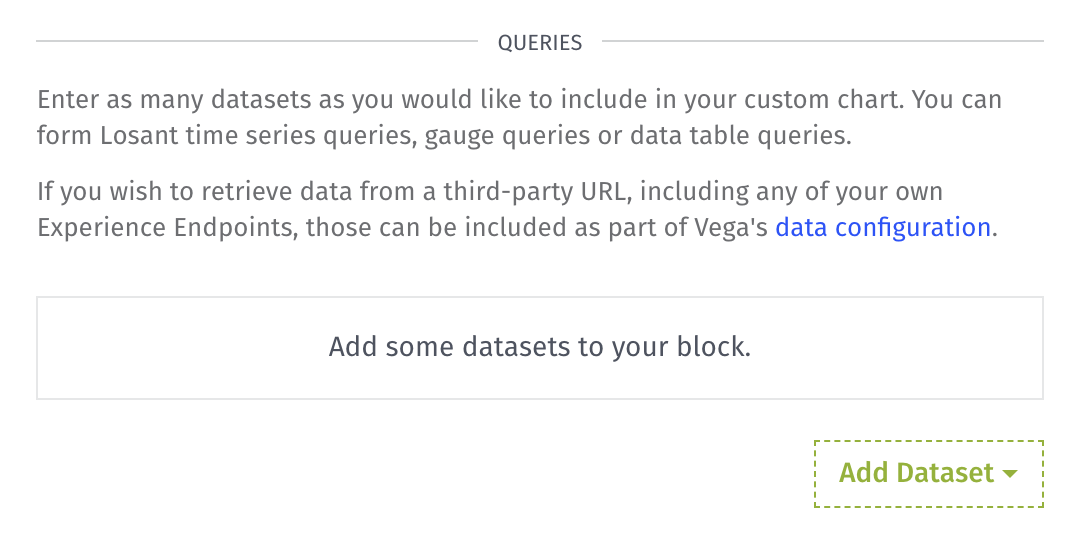
All query types include a Query Name property which is how each individual query's data is referenced in the Vega/Vega-Lite configuration.
A Query Result section will appear at the bottom of each segment allowing you to see the data returned by the query.
Time Series Queries
Time series queries provide a dataset that includes the value of a single attribute from a selected device over a duration of time at a selected resolution. The values returned from the query will be returned as an array of objects in the form of:
[
  { "time": <time>, "value": <value> },
  { "time": <time>, "value": <value> },
  { "time": <time>, "value": <value> }
]
The values returned will reflect the selected attribute's value specified at the reported time. This is the same data that is used in the Time Series Block.
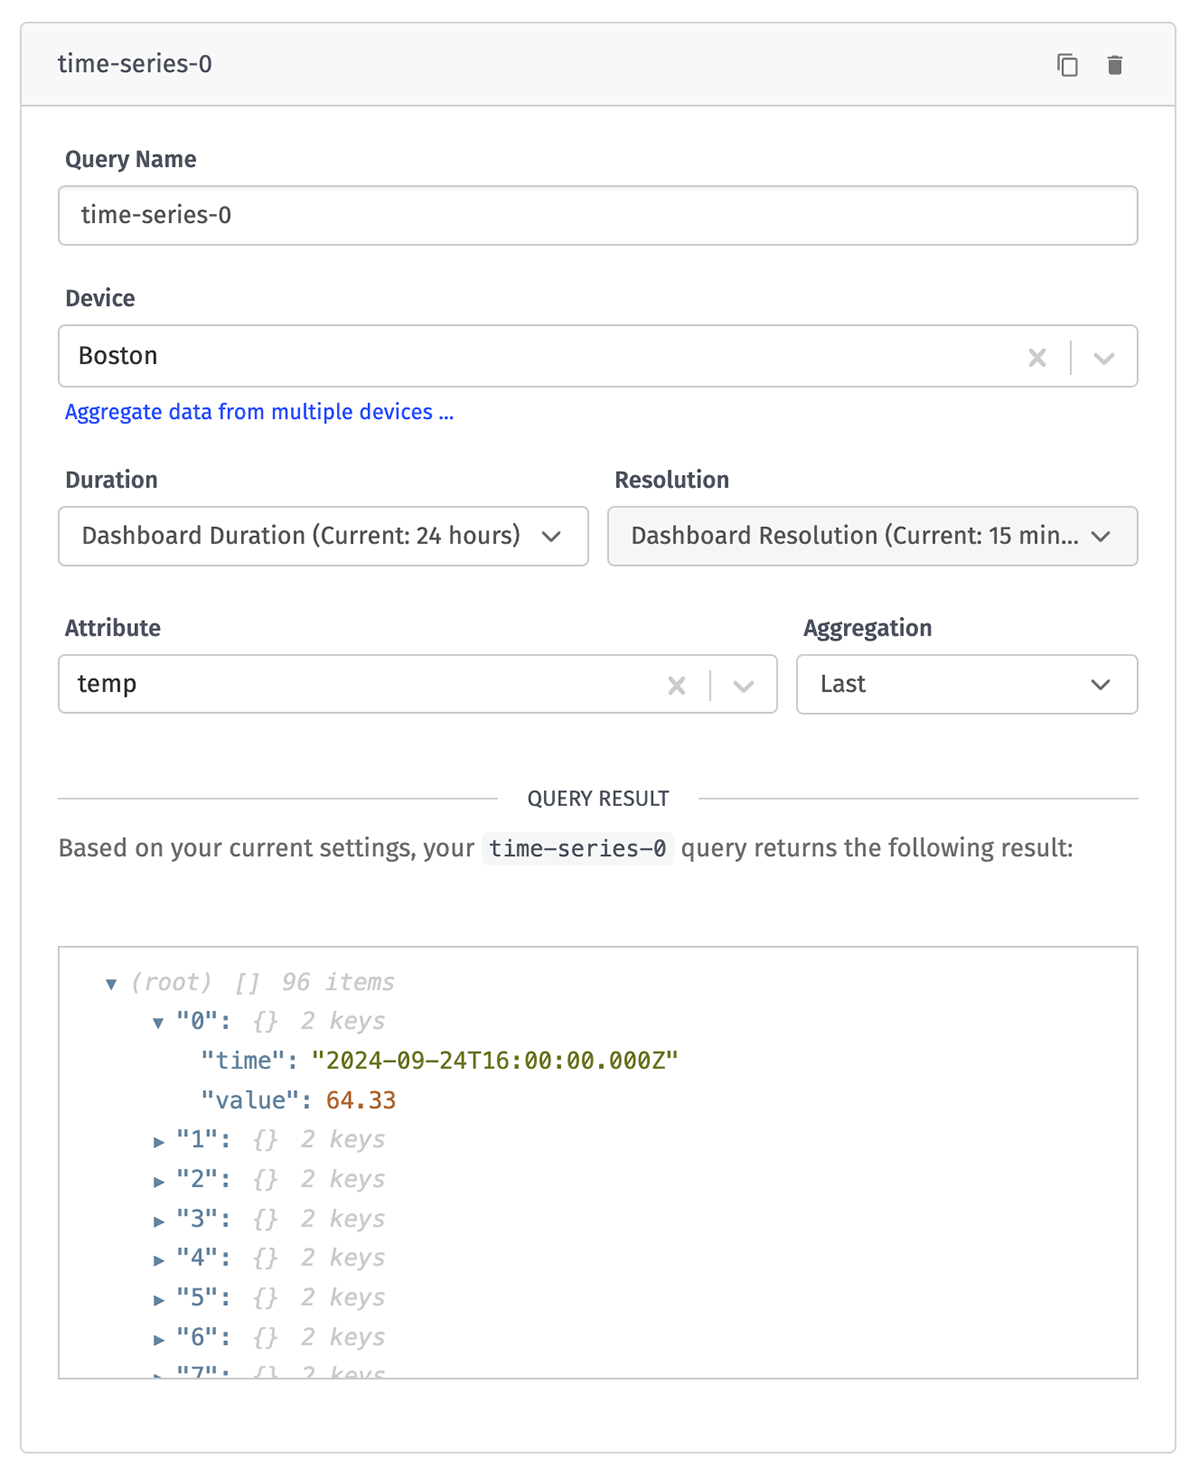
The parameters of the Time Series Query include:
- Query Name is what will be referenced in the Vega/Vega-Lite configuration in order to access the returned dataset.
- Device is a device query for selecting device(s) for which to return aggregated data.
- Duration is how far into the past you want to look at the data. This defaults to the global dashboard duration.
- Resolution is how your data will be grouped. These options will change based on what you specify for the duration. This defaults to the global dashboard resolution.
- Attribute is the device attribute whose value will be returned in the query. Note that if data from more than one device is being displayed, each of those devices must supply the same attribute name.
- Aggregation determines how all the available data returned should be aggregated before being returned. This defaults to "Last".
Gauge Queries
Gauge Queries allow you to query a single attribute from a selected device. You can choose to return either the last reported value of the attribute or the value from a selected aggregation over a selected duration of time.
This query returns an array with a single item - an object in the form of { "time": <time>, "value": <value> }. The value of time in the returned data is the time that the query was made and the value of value is the data of the attribute after the selected aggregation has been performed.
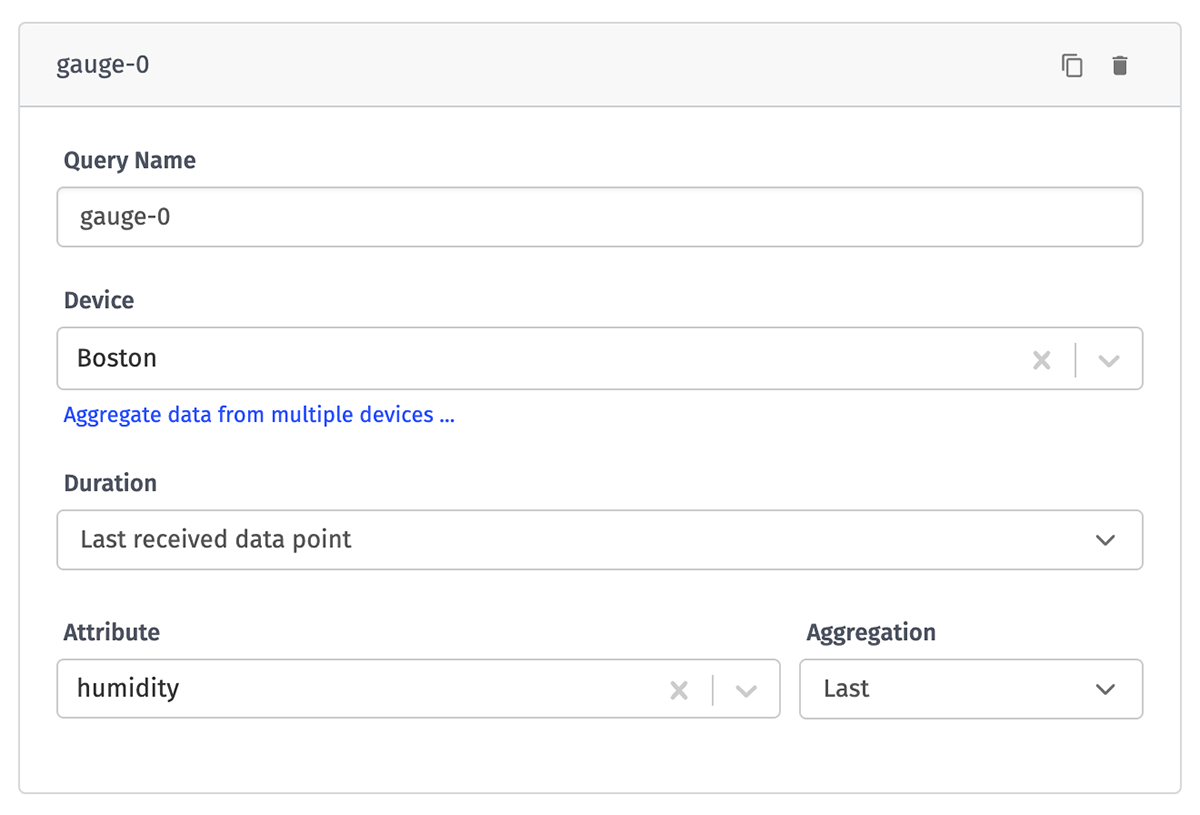
The parameters of the Gauge Query include:
- Query Name is what will be referenced in the Vega/Vega-Lite configuration in order to access the returned dataset.
- Device is a device query for choosing which device(s) to return aggregated data for.
- Duration is how far into the past you want to query for data. This defaults to the last received data point (relative to the dashboard end time).
- Attribute is the device attribute whose value will be returned in the query. Note that if data from more than one device is being displayed, each of those devices must supply the same attribute name.
- Aggregation determines how all the available data returned should be aggregated before being returned. This defaults to "Last".
Data Table Queries
Data table queries allow you to query any data that is stored on a data table. The data table query will return an array of your data table rows where the column names will be the keys you will reference. We will automatically generate a list of columns that are available to query as well as all default row data.
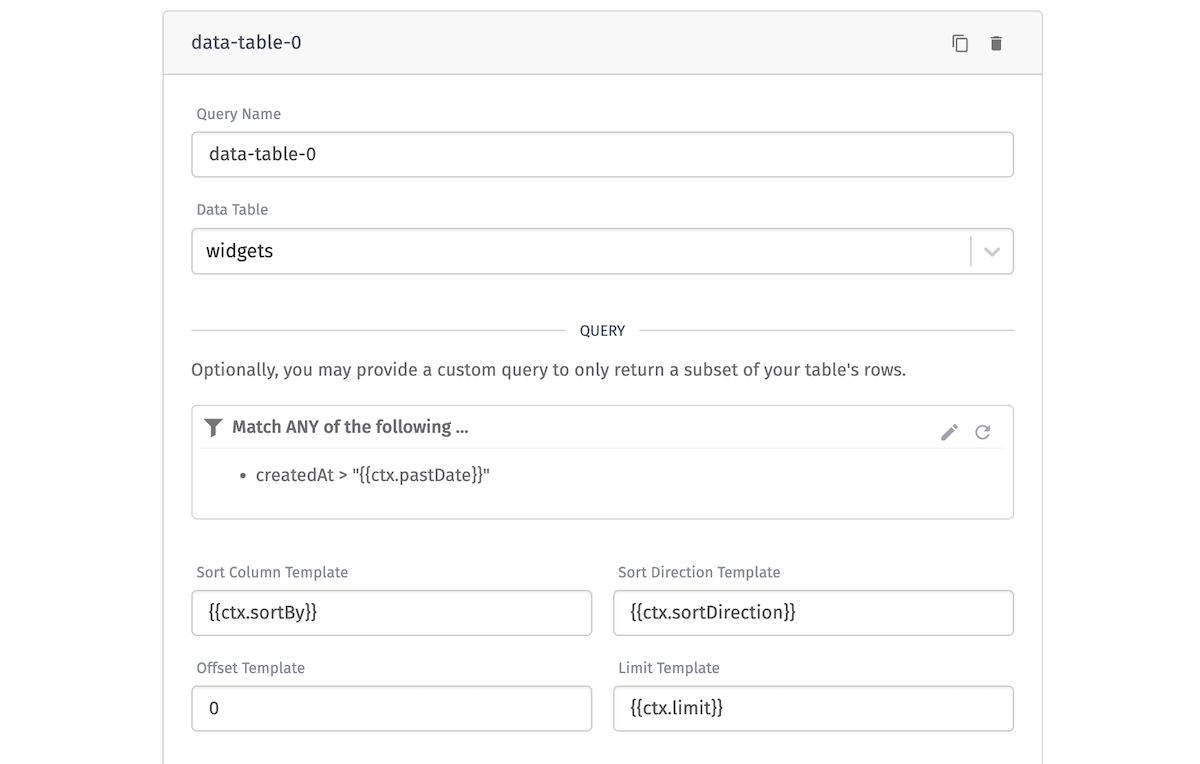
The parameters of the Data Table Query include:
- Query Name is what will be referenced in your block's JavaScript code.
- Data Table is the table that you're querying.
- Query is a query built the same way as in the Table: Get Rows Node, where an array of individual queries can be joined with an "OR" or "AND" operator.
- Sort Column Template is the column on the data table to sort by. By default, this field is
id. The following are the valid sort fields:id,createdAt,updatedAt, as well as any custom columns on the table. This field is templatable. - Sort Direction Template is the direction the sort column sorts in. By default, this field is
asc. The valid sort directions areascanddesc. This field is templatable. - Offset Template is the number of results to skip, allowing you to paginate through large numbers of rows. This number must be positive, and the default is
0. This field is templatable. - Limit Template is the maximum number of rows to return with one query. The max number of rows that can be returned at once is 10000. The default is
1000. This field is templatable.
Device Info Queries
Device info queries allow you to query device metadata including device names, descriptions, attributes, tags, and optionally connection info and attribute composite states. The device info query returns an array of objects in the form of:
[
  {
    "deviceClass": "floating",
    "name": "Test Device",
    "tags": [
      {
        "key": "foo",
        "value": "bar"
      }
    ],
    "applicationId": "5a67b4d91d5531000772e755",
    "creationDate": "2021-02-10T23:37:41.385Z",
    "lastUpdated": "2022-06-07T02:37:30.071Z",
    "attributes": [
      {
        "name": "num",
        "dataType": "number",
        "attributeTags": {
          "s": "d"
        }
      }
    ],
    "_etag": "\"1ac-Ig5eB2pZ/XWMNKaFEvhNzHmTP14\"",
    "deviceId": "60246e459d64660006025152",
    "id": "60246e459d64660006025152",
    "connectionInfo": {
      "connected": null
    },
    "attributeValues": {
      "num": 42
    },
    "_type": "device"
  },
  ...
]
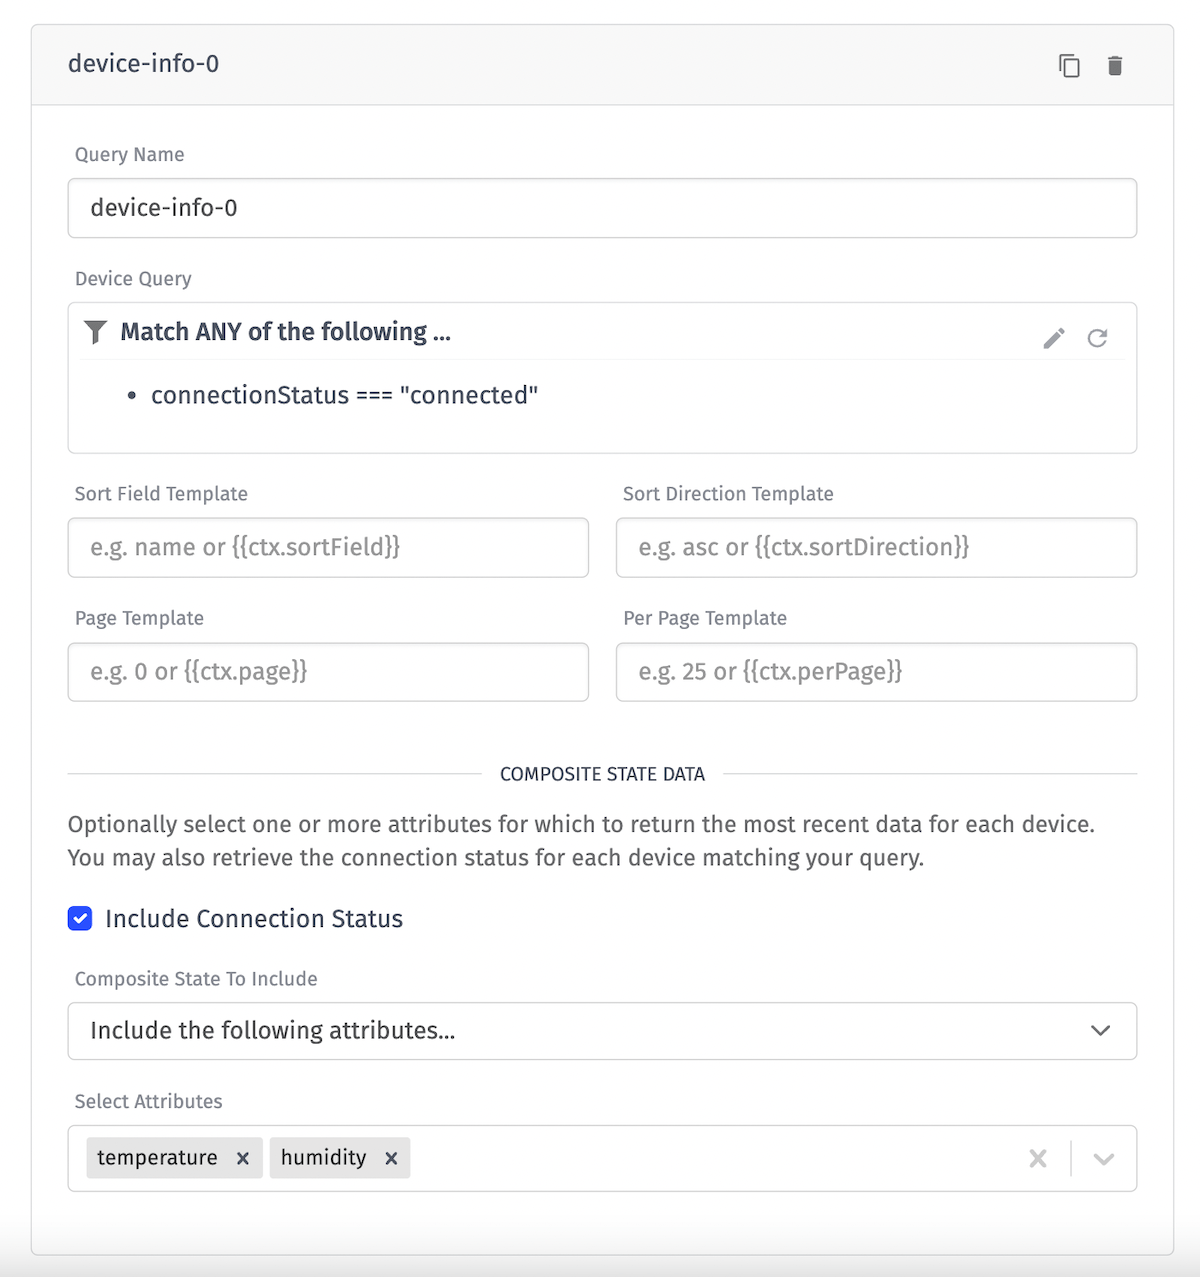
The parameters of the Device Info Query include:
- Query Name is what will be referenced in the Vega/Vega-Lite configuration in order to access the returned dataset.
- Device Query is an advanced query for choosing which devices' metadata you want to access.
- Sort Field Template is the property on the devices to sort by. By default, this field is
name. The following are the valid sort fields:name,id,creationDate, orlastUpdated. This field is templatable. - Sort Direction Template is the direction the sort field sorts in. By default, this field is
asc. The valid sort directions areascanddesc. This field is templatable. - Page Template is the number of results to skip by multiplying this number by the
Per Page Templatefield, allowing you to paginate through large numbers of devices. This number must be greater than 0, and the default is0. This field is templatable. - Per Page Template is the maximum number of devices to return with one query. The max number of devices that can be returned at once is 1000. The default is
25. This field is templatable. - Include Connection Status allows you to enable or disable device connection info being returned in the query.
- Composite State To Include determines if the last known state attribute values will be included for each device. These will be added to the device object under the
attributeValueskey. The valid options for this are:Include no attributes: This is the default, and means no composite state will be returned.Include all attributes: This will return composite state for every attribute on the device.Include the following attributes: This will return composite state for the specifically selected attributes set in theSelect Attributesfield.
- Select Attributes determines which attributes to return composite states for when the
Composite State To Includefield is set toInclude the following attributes
Event Queries
Event queries allow you to query Events generated through your application logic. The event info query returns an array of objects in the form of:
[
  {
    "_type": "event",
    "id": "680aa046d6946472ddd52048", // unique ID of the event
    "applicationId": "5a67b4d91d5531000772e755", // ID of the application
    "creationDate": "2025-04-24T20:34:14.833Z", // date-time the event was created
    "lastUpdated": "2025-05-27T17:06:12.273Z", // date-time the event was last updated
    "level": "critical", // the level assigned to the event on creation ("critical", "error", "warning", or "info")
    "state": "acknowledged", // the event's current state ("new", "acknowledged", or "resolved")
    "subject": "Temperature high", // subject assigned to the event on creation
    "eventTags": { // key-value mapping of event tags, which can change over the lifecycle of the event
      "tagKey": "tag value"
    }
  },
  ...
]
In addition to the properties above, each event object will also contain the following properties if the user viewing the dashboard has application permissions or if the "Include extended info" box is checked in the segment configuration ...
{
  "data": { // additional JSON data provided on event creation, if applicable
    "temp": "109"
  },
  "deviceId": "60b8ec6155944a000699e77f", // ID of the device associated with the event, if applicable
  "deviceName": "Temp Sensor", // name of the device associated with the event, if applicable
  "eventId": "680aa046d6946472ddd52048", // unique ID of the event, equal to the "id" property
  "message": "Temp recorded at 109", // event description provided on creation
  "sourceId": "56c7420e63b022010029fabc", // ID of the entity that created the event, be it a workflow, user, etc.
  "sourceName": "Temp Alerts", // name of the entity that created the event
  "sourceType": "flow", // type of entity that created the event ("user", "apiToken", or "flow")
  "updates": [ // an array of updates applied to the event over time, if applicable ...
    {
      "comment": "Faulty sensor suspected", // comment provided with the update
      "creationDate": "2025-05-27T17:06:12.271Z", // date-time of the event update
      "sourceId": "56c7420e63b022010029fcd3", // ID of the entity responsible for this update
      "sourceName": "support@losant.com", // name of the entity responsible for this update
      "sourceType": "user", // type of the entity responsible for this update ("user", "apiToken", or "flow")
      "state": "acknowledged", // state of the event after the update
      "stateChange": {
        "new": "acknowledged", // state of the event after the update
        "old": "new" // state of the event prior to the update
      }
    }
  ]
}
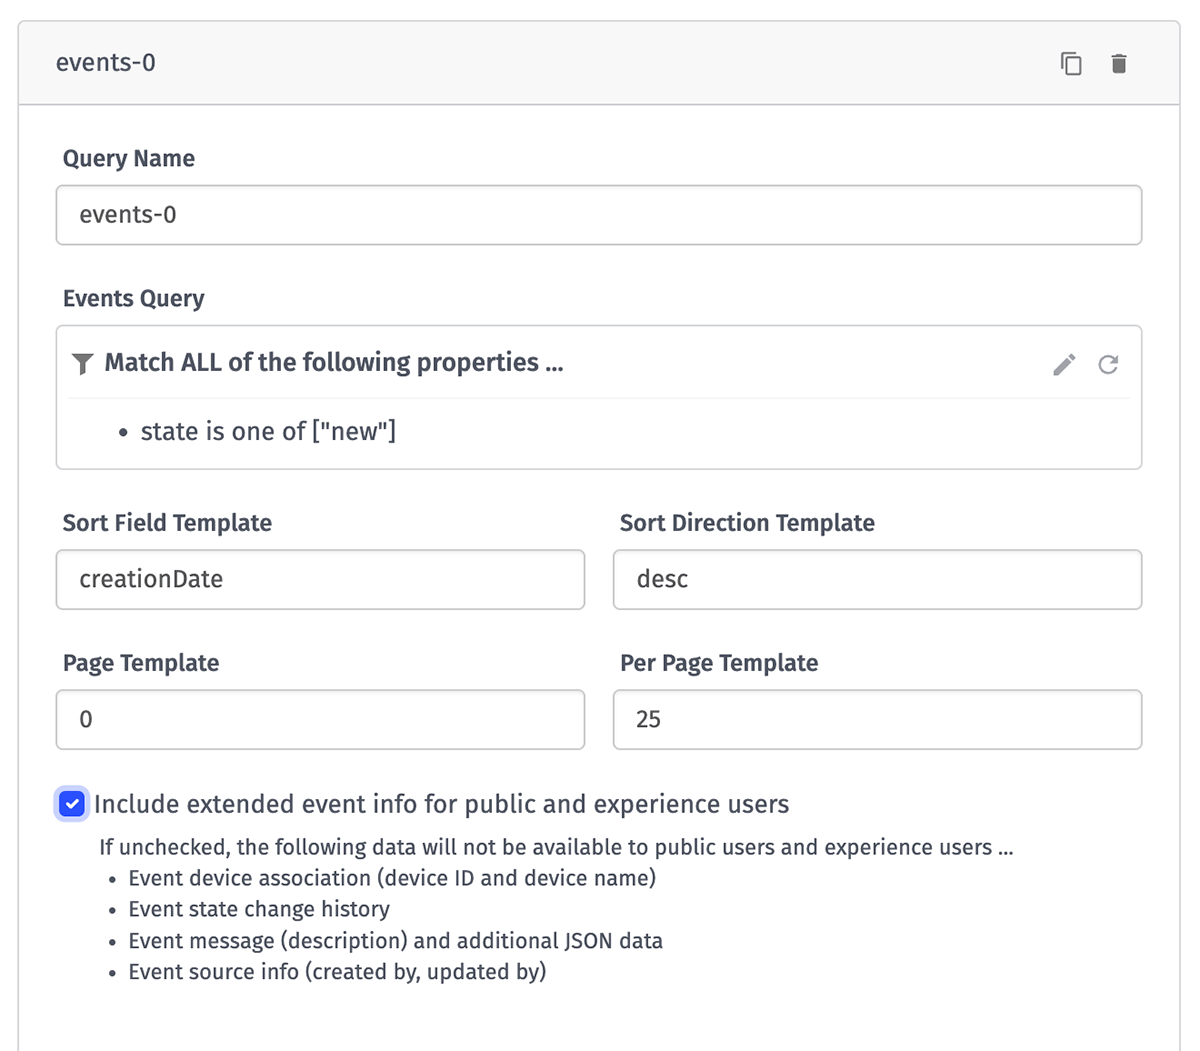
The parameters of the Event Info Query include:
- Query Name is what will be referenced in the Vega/Vega-Lite configuration in order to access the returned dataset.
- Events Query is an advanced query for choosing which events you want to access.
- Sort Field Template is the property on the events to sort by. By default, this field is
creationDate. The following are the valid sort fields:id,subject,level,creationDate, orlastUpdated. This field is templatable. - Sort Direction Template is the direction the sort field sorts in. By default, this field is
desc. The valid sort directions areascanddesc. This field is templatable. - Page Template is the number of results to skip by multiplying this number by the
Per Page Templatefield, allowing you to paginate through large numbers of events. This number must be greater than 0, and the default is0. This field is templatable. - Per Page Template is the maximum number of events to return with one query. The max number of events that can be returned at once is 1000. The default is
25. This field is templatable. - Include extended event info for public and experience users, if checked, returns additional information about each event as described above.
Vega/Vega-Lite Configuration
Once you have a query, you will have to choose what version of Vega or Vega-Lite you want to use for your chart and write a custom configuration for your chart.
The $schema field will be added automatically based on the Vega/Vega-Lite version. The default block configuration will be sized to the Dashboard Block size and is not valid as you will have to provide the data.
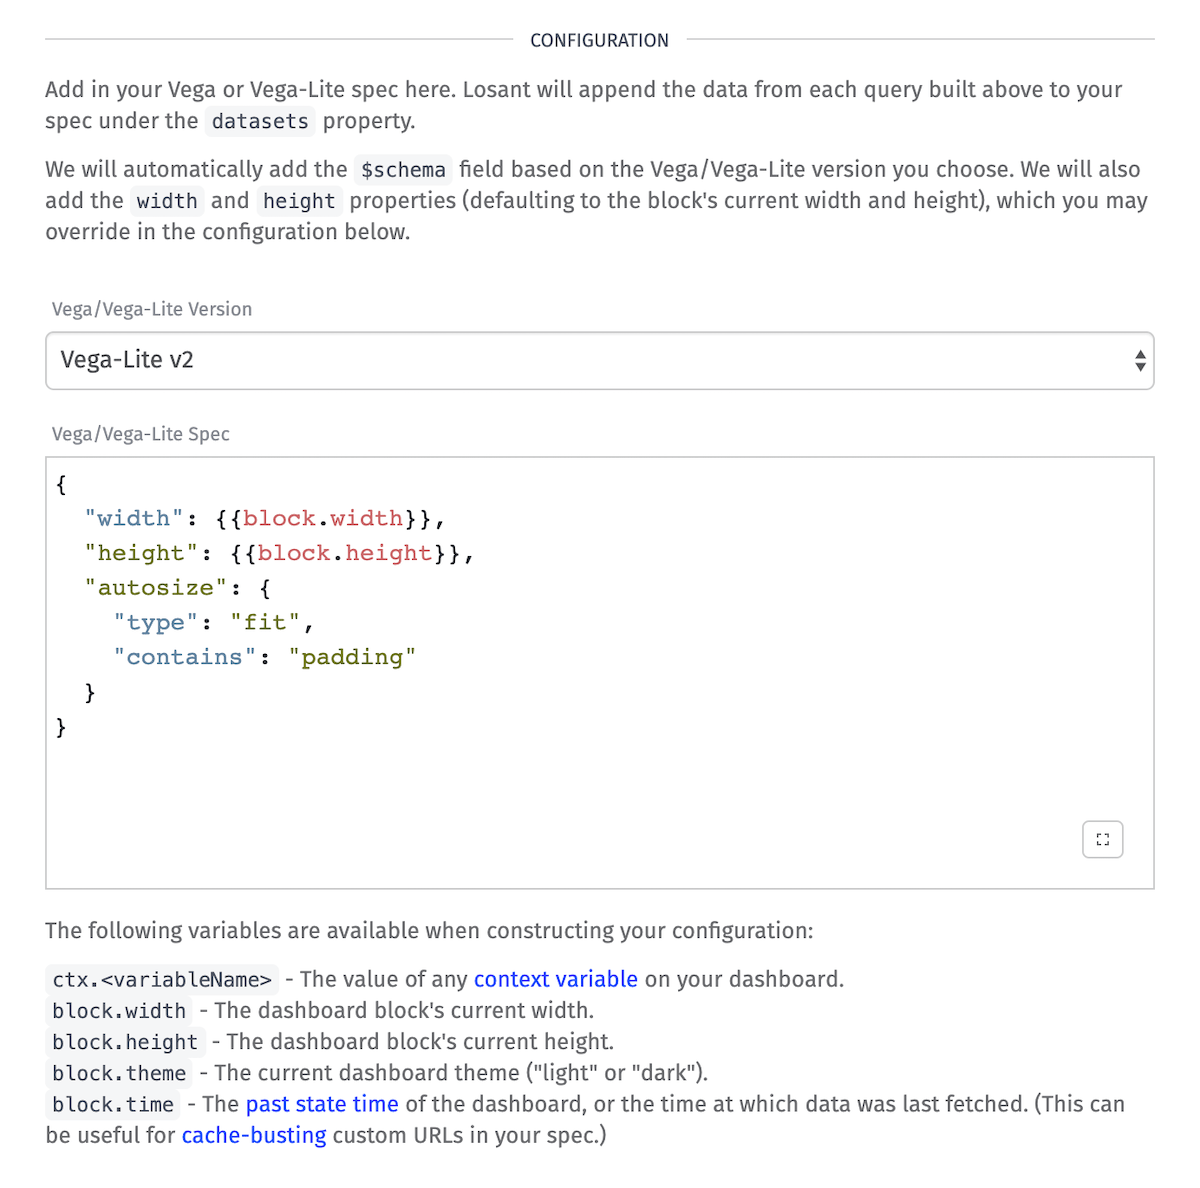
When referencing a query, it is a Vega Named Data Source based on the what is entered in the "Query Name" field. All queries will be formatted as JSON data; no need to set a data format in your configuration.
Keep in mind that you can use any valid Vega/Vega-Lite Data Source to populate your chart, not just any of your previously created queries.
For more information on configuring Vega/Vega-Lite, please reference the documentation for the Vega/Vega-Lite version you choose to use. Losant provides support for the following versions:
Examples
The examples provided below are written using Vega/Vega-Lite v2.
Time Series Bar Chart
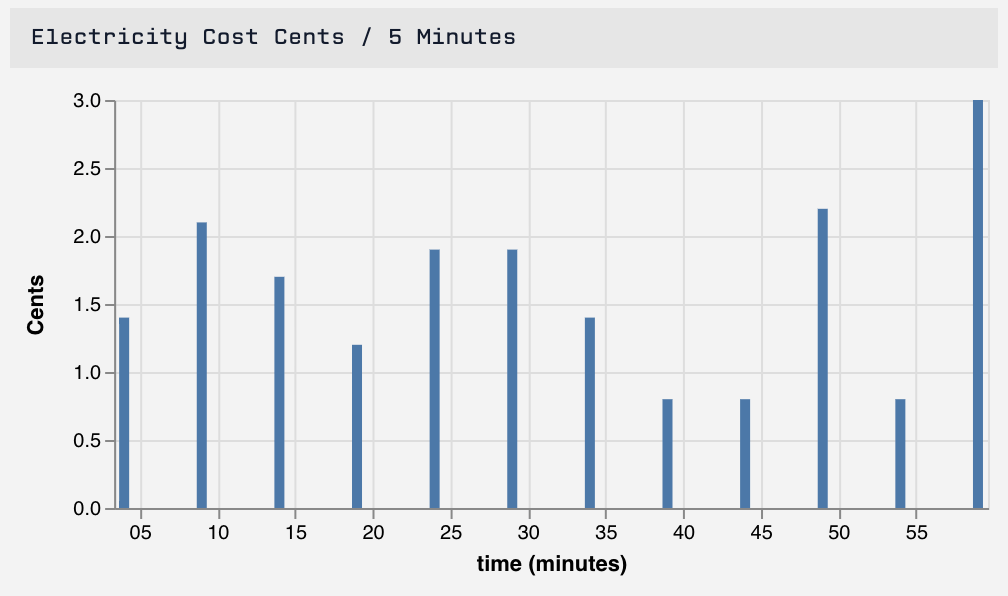
{
  "width": {{block.width}},
  "height": {{block.height}},
  "autosize": {
    "type": "fit",
    "contains": "padding"
  },
  "description": "A simple time series bar chart.",
  "data": {
    "name": "time-series-0"
  },
  "mark": "bar",
  "encoding": {
    "x": {
      "field": "time",
      "type": "temporal",
      "timeUnit": "minutes"
    },
    "y": {
      "field": "value",
      "type": "quantitative",
      "axis": {"title": "Cents"}
    }
  }
}
Layered Time Series Line Chart with Gauge as Average Line
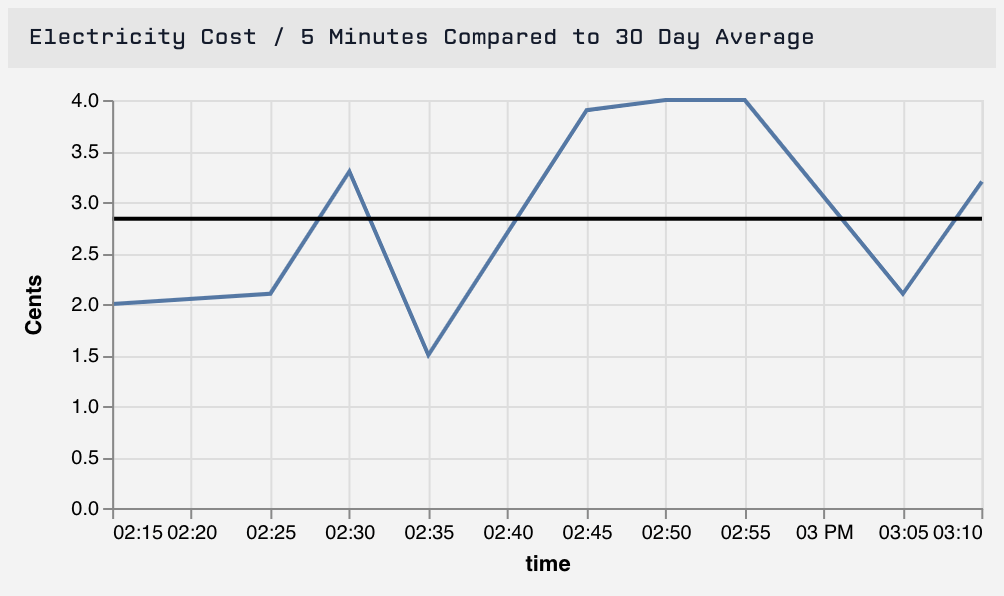
{
  "width": {{block.width}},
  "height": {{block.height}},
  "autosize": {
    "type": "fit",
    "contains": "padding"
  },
  "layer": [
    {
      "data": {
        "name": "time-series-0"
      },
      "mark": "line",
      "encoding": {
        "x": {
          "field": "time",
          "type": "temporal"
        },
        "y": {
          "field": "value",
          "type": "quantitative",
          "axis": {
            "title": "Cents"
          }
        }
      }
    },
    {
      "data": {
        "name": "gauge-0"
      },
      "mark": "rule",
      "encoding": {
        "y": {
          "field": "value",
          "type": "quantitative"
        },
        "size": {"value": 2}
      }
    }
  ]
}
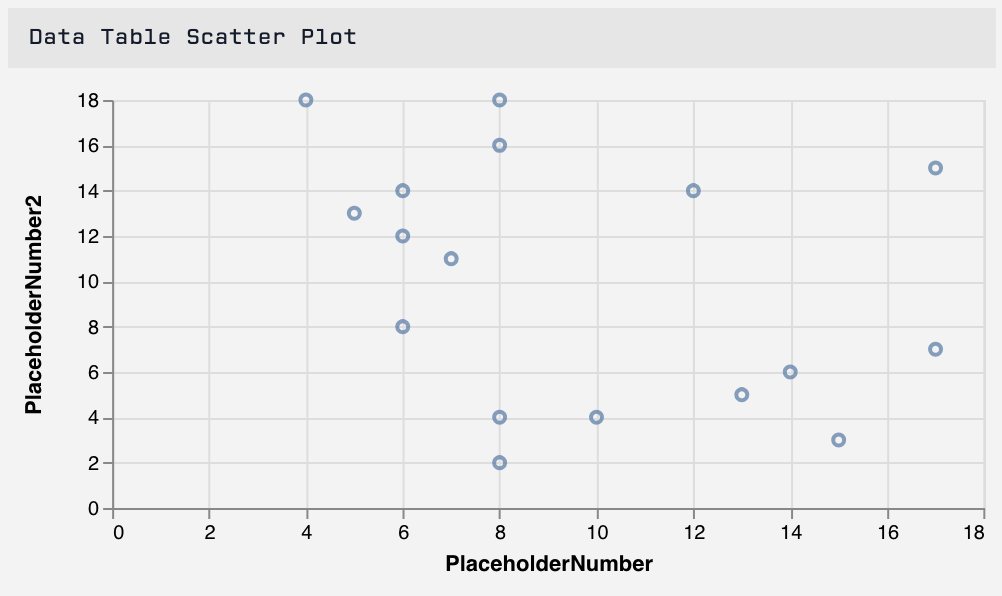
Data Table Scatter Plot

{
  "width": {{block.width}},
  "height": {{block.height}},
  "autosize": {
    "type": "fit",
    "contains": "padding"
  },
    "description": "A simple time series bar chart.",
  "data": {
      "name": "data-table-0"
  },
  "mark": "point",
  "encoding": {
    "x": {
      "field": "PlaceholderNumber",
      "type": "quantitative"
    },
    "y": {
      "field": "PlaceholderNumber2",
      "type": "quantitative"
    }
  }
}
Was this page helpful?
Still looking for help? You can also search the Losant Forums or submit your question there.