Gateway Edge Agent Walkthrough
This guide provides a complete walkthrough for using Losant's Gateway Edge Agent to read data from a piece of industrial equipment using Modbus and then report that data to the cloud.
Introduction
This system is made up of a kegerator with a Banner Temperature & Humidity Sensor installed inside it, a Banner Wireless Controller, and a Raspberry Pi as the Edge Compute device.
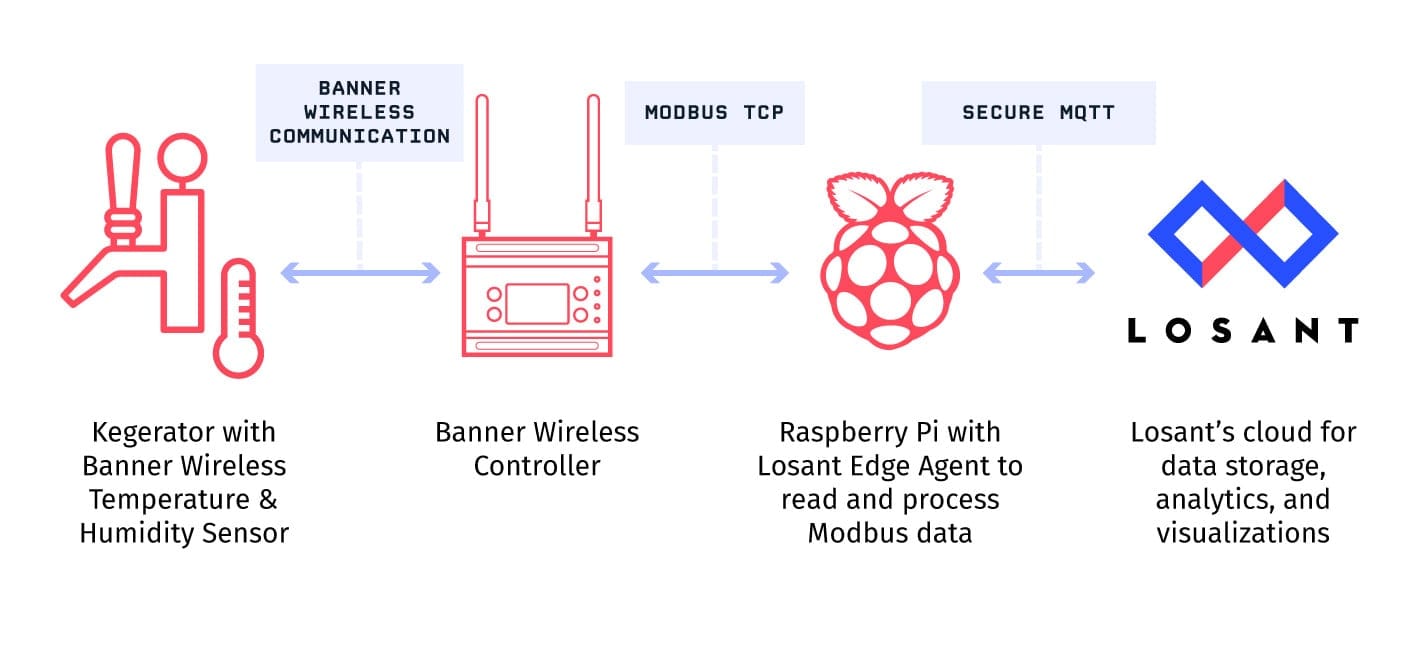
The Banner Wireless Controller reads sensor data from any number of remote sensors and then exposes that information to your local network over Modbus TCP. The Edge Compute device can then read that Modbus endpoint and report the data to the cloud. Banner is just an example used for this walkthrough. The same lessons apply to any Modbus TCP capable devices you may have.
Register the Devices
Edge Compute device types can report state for themselves or for any number of peripheral devices. This example includes one peripheral, which is the kegerator itself. The Raspberry Pi will be the Edge Compute device that's responsible for reading the Modbus endpoint.
Using the Devices -> Add Device button in your application page, first create the Edge Compute device.

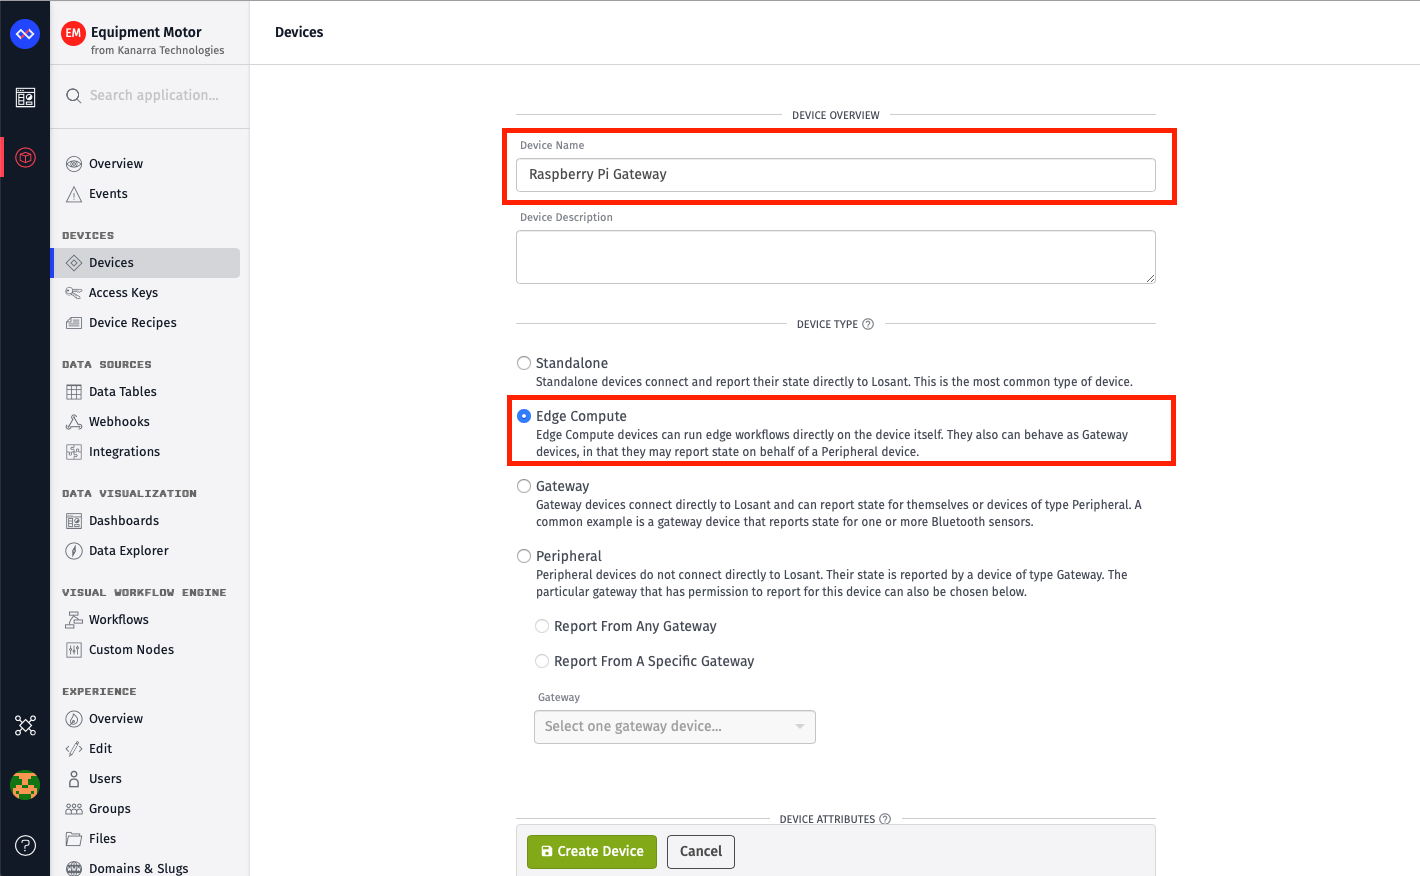
In this example, the device is named "Raspberry Pi Gateway", however you can name it anything you'd like. The only other required setting is to make the device type Edge Compute. This device doesn't need any attributes because the actual temperature and humidity information will be added to our peripheral device. Click the Create Device button to add this new device to your application.
Next, create a second device for the Kegerator peripheral.
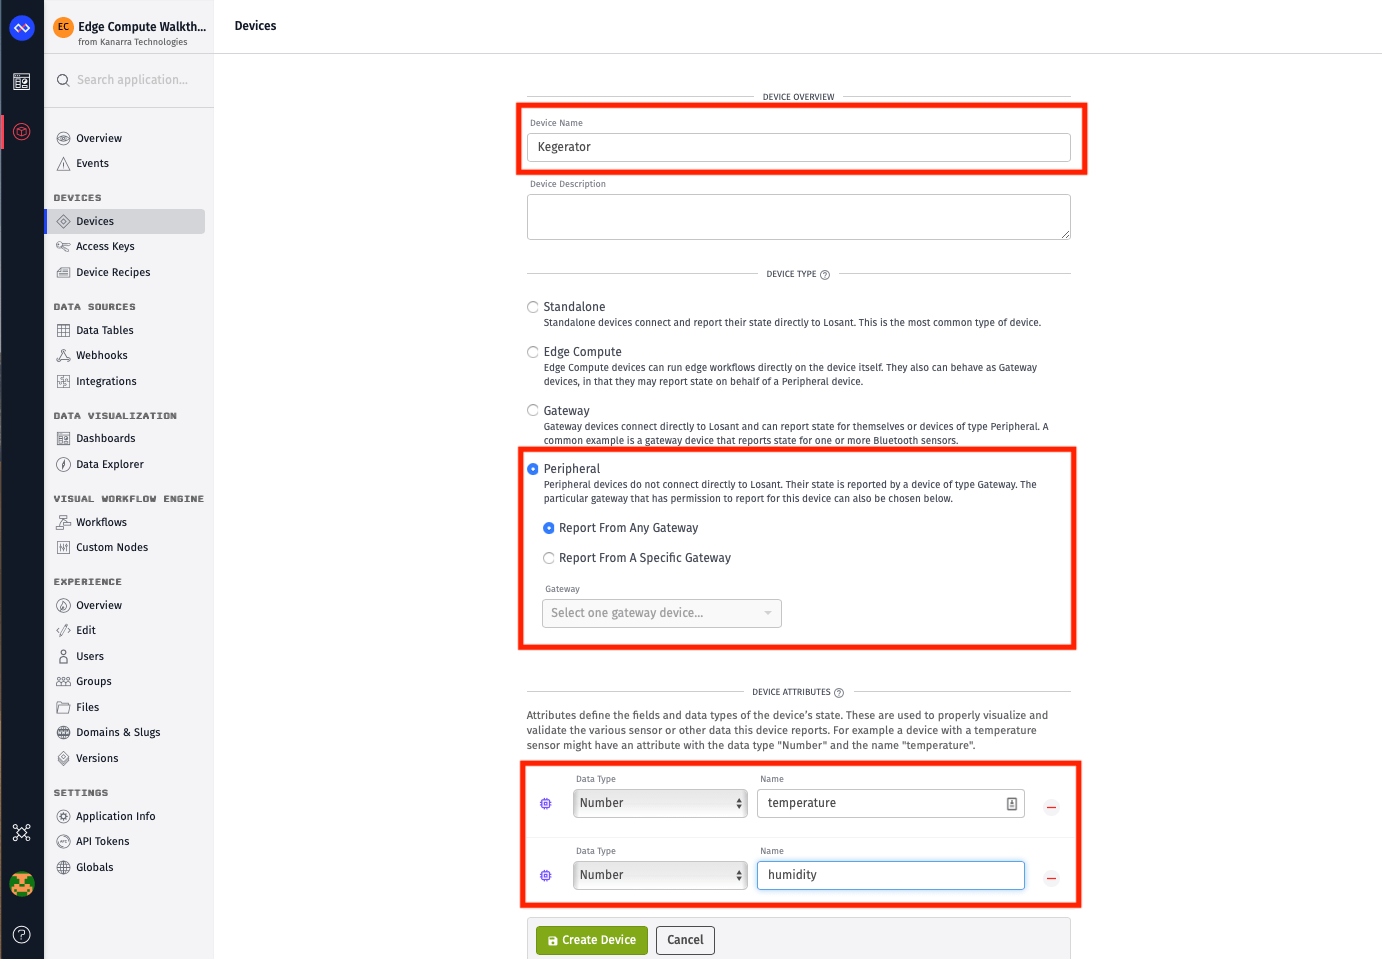
In this example we named the device "Kegerator", but you can name it anything you'd like. Set the device type to Peripheral and set the gateway to our previously created Edge Compute device. This is primarily an access control setting, which restricts which gateways are allowed to report state on behalf of this peripheral. Click the Create Device button to add this device to your application, and on the next screen, add add the two attributes for temperature and humidity (with a data type of "Number").
Create Access Key and Secret
In order for the Raspberry Pi to communicate with Losant, it requires authentication details. Within Access Keys, create a new access key and secret for this device.
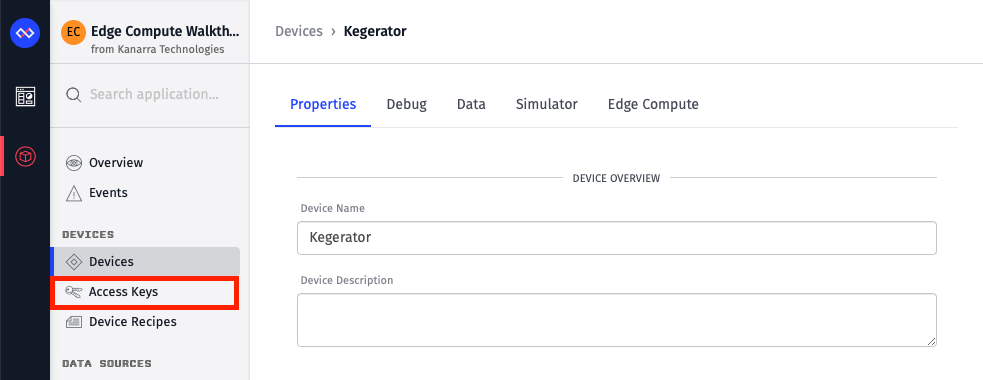

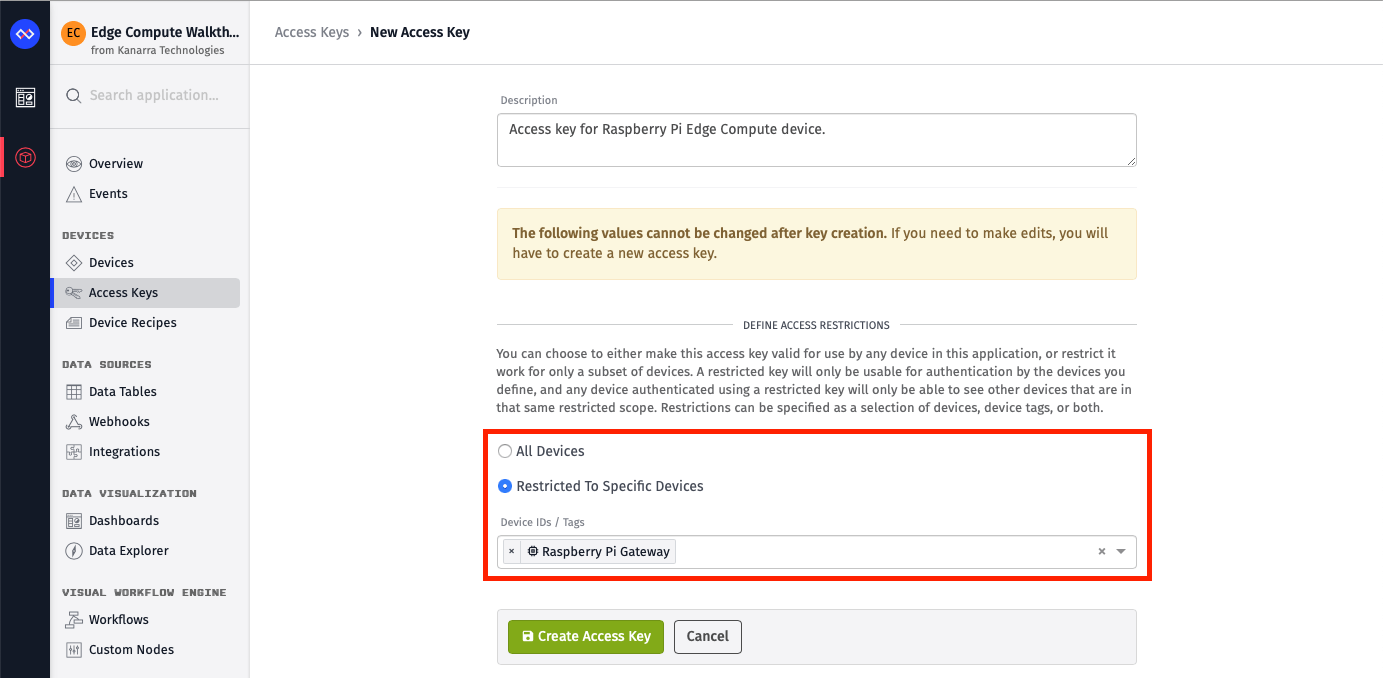
We always recommend creating a dedicated access key for each device. With that said, select the Restricted To Specific Devices radio and choose your previously created Edge Compute device.
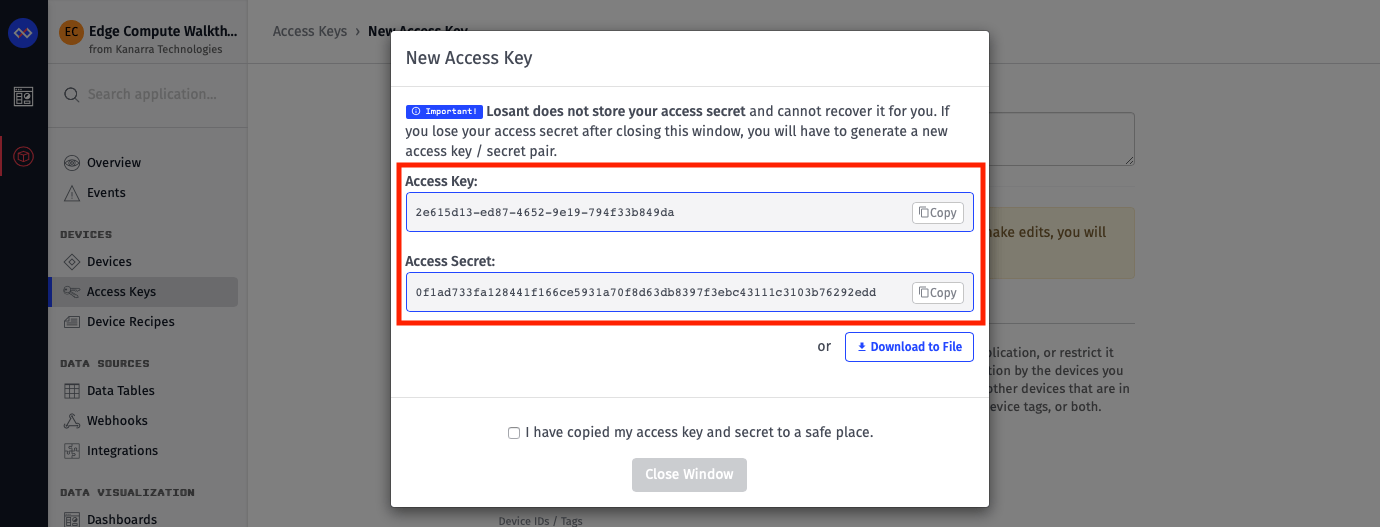
After clicking Create Access Key, you'll be presented with a popup with your newly created access key and secret. Losant does not store the secret, so it's very important to copy/paste this somewhere safe. You'll be using this information later in this guide.
Install the Gateway Edge Agent
Losant Edge Compute works by deploying edge workflows to your edge compute devices. In order to receive, process, and manage these workflows on the device, Losant's Gateway Edge Agent (GEA) must be installed.
Follow the Agent Installation Guide for step-by-step instructions.
Configure and Run the GEA
Once the Gateway Edge Agent is installed, you can authenticate it with the access key and secret you created earlier. There are two ways to configure the GEA: through a configuration file or using environment variables. Generally we recommend using a configuration file.
Create a configuration file at /var/lib/losant-edge-agent/config.toml with the following contents.
[logger]
out = '/data/losant-edge-agent-log.log'
level = 'verbose'

[gateway]
id = '<your-edge-compute-device-id>'
key = '<your-access-key>'
secret = '<your-access-secret>'

[store]
path = '/data/losant-edge-agent-store.db'
The Gateway Edge Agent also stores data locally, so it's recommended to create a local folder and mount it inside the Docker container when you run it. This way, the data persists between restarts of the container.
sudo mkdir -p /var/lib/losant-edge-agent/data
sudo chmod a+rwx -R /var/lib/losant-edge-agent
These commands will create a data folder at /var/lib/losant-edge-agent/data and set the required permissions. You will only ever have to run these commands once.
You can now run the Gateway Edge Agent using the following Docker command.
docker run -d --restart always --name losant-edge-agent \
  -v /var/lib/losant-edge-agent/data:/data \
  -v /var/lib/losant-edge-agent/config.toml:/etc/losant/losant-edge-agent-config.toml \
  losant/edge-agent
If you open the Edge Compute device page prior to running this command, you'll see it log some connection information when the GEA starts up.
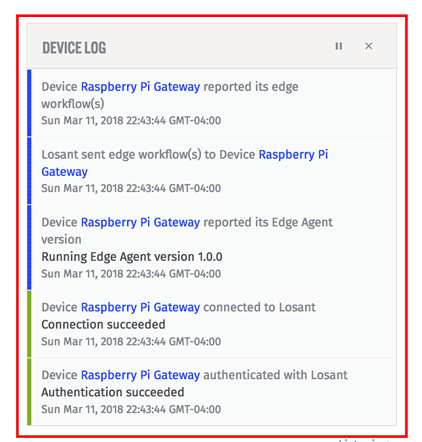
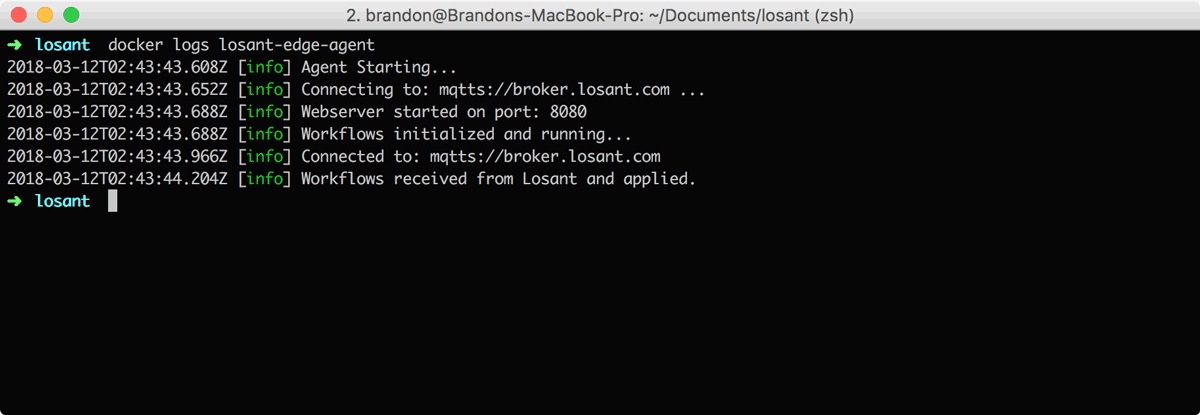
If nothing shows in the device log when the GEA starts, try inspecting the logs locally using the command below.
docker logs losant-edge-agent
You should see an output similar to the image below. If there are any errors, they will be displayed and should provide helpful information to debug any issues.
If you need to fix or change any configuration fields, you can simply edit the config.toml file and run docker restart losant-edge-agent to apply the changes.
Build the Workflow
Now that you have the GEA installed and running, you can build and deploy an edge workflow to start reading Modbus information.
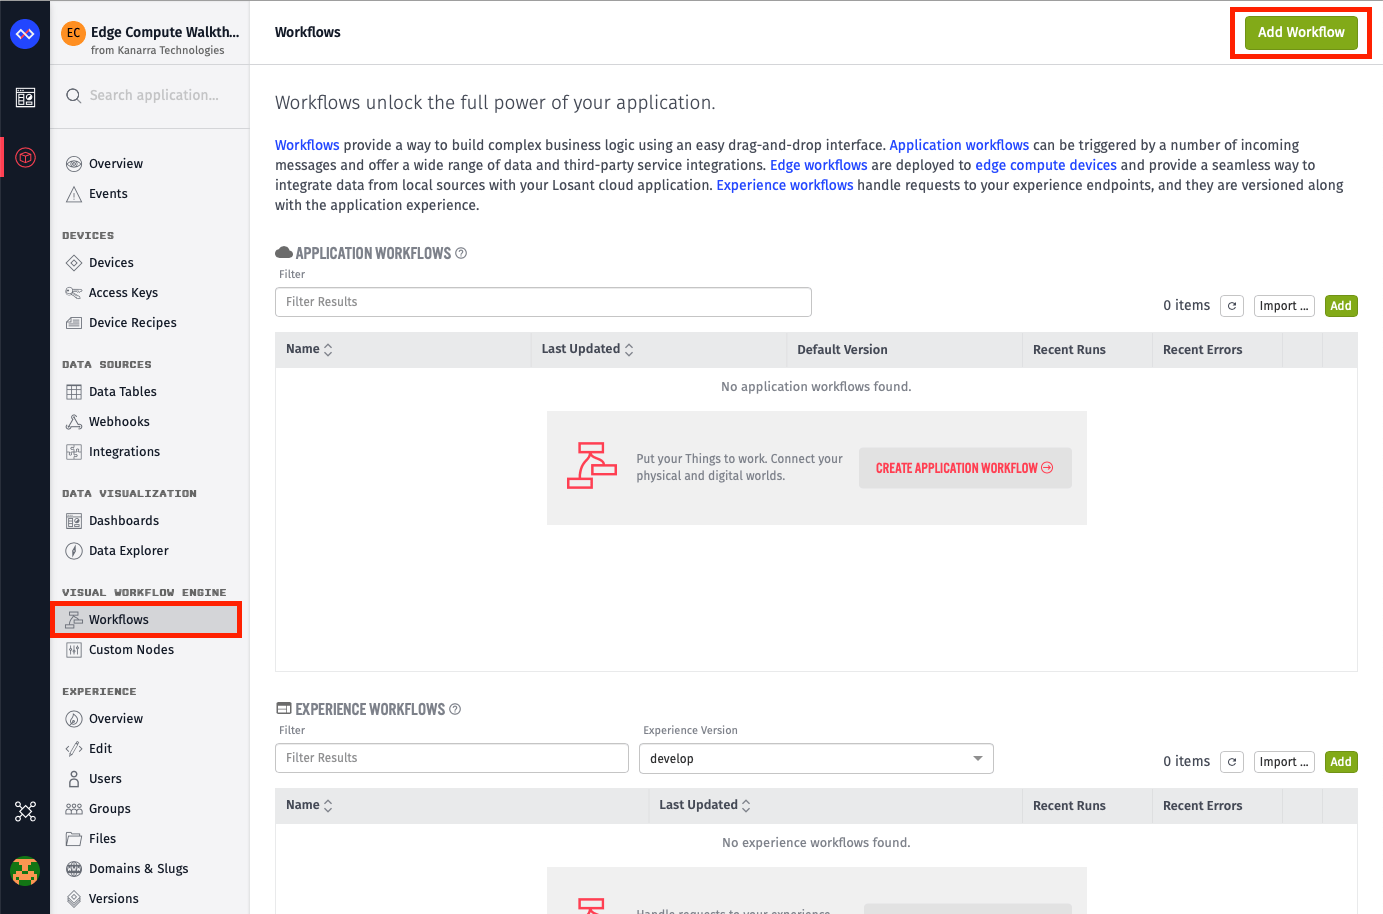
You can create an edge workflow by clicking Workflows -> Add Workflow.
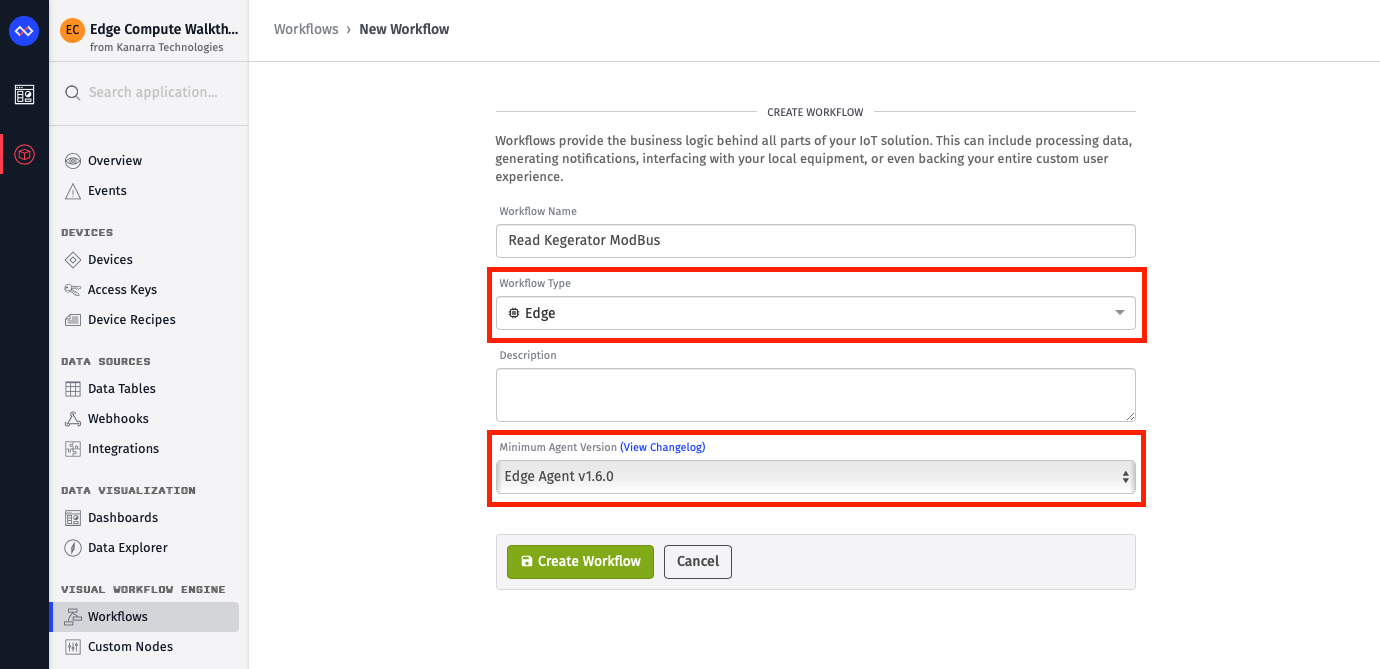
It's important to ensure the version you select for Minimum Agent Version is the same or below whatever you have installed on your edge devices. Losant continually updates the GEA with new capabilities. This setting ensures the workflows you're about to build will be supported by the GEA version you have installed. We always default this option to the latest GEA version, so if you just installed the it for the first time, you should be good to go.
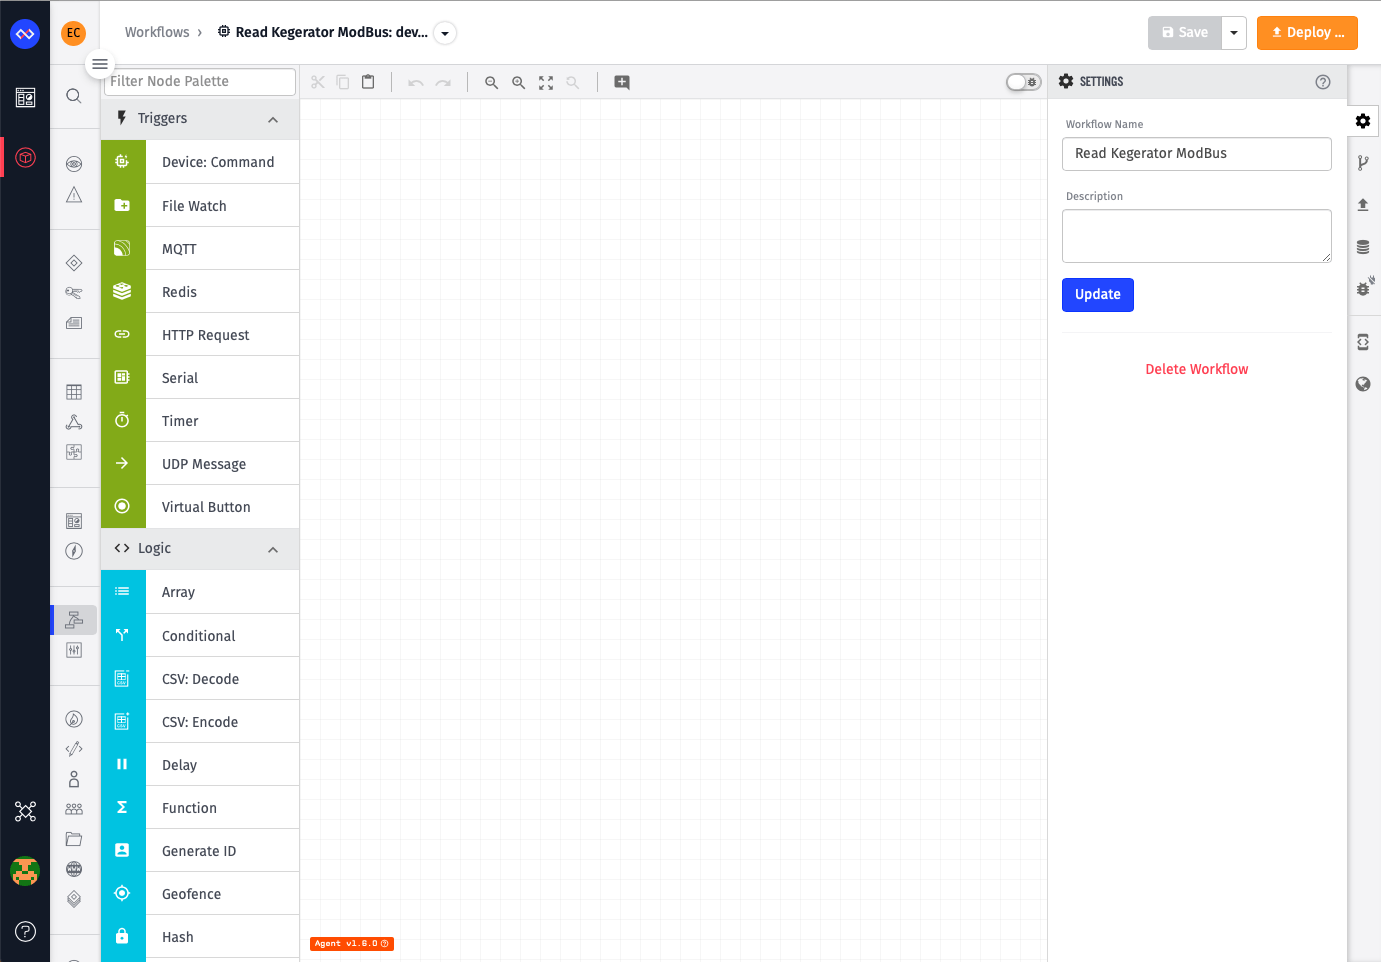
Once you click Create Workflow, you'll be presented with a blank edge workflow canvas.
Read Modbus Registers
The workflow you'll create in this example will read two Modbus registers every minute, convert them from raw data to actual measurements, and then report that data to Losant's cloud.
Start by first dragging a Timer Trigger, a Modbus: Read Node, and a Debug Node onto the canvas. Connect each node together and then configure the Modbus: Read Node to read your specific Modbus endpoint. The configuration below is for our Banner Wireless Controller, which is reading the temperature sensor in the kegerator.
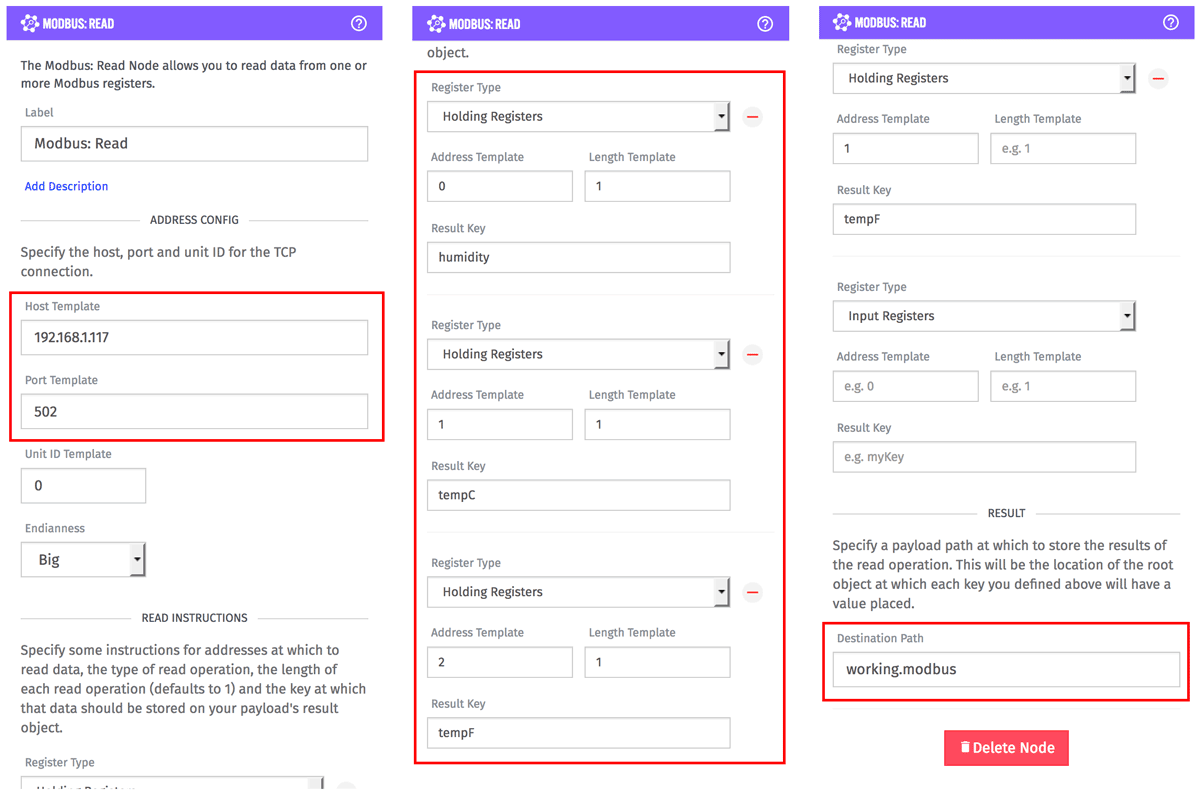
The Modbus: Read Node has three primary configuration sections. The first is the endpoint itself, which on our network is located at the address 192.168.1.117 on port 502. You can also adjust the Unit ID or Endianness if your environment requires those to be changed.
The next section includes the registers to read. This will change greatly depending on what piece of equipment you're reading from, but our Banner Wireless Controller is configured to expose the humidity on Holding Register 0, the temperature in Celsius on Holding Register 1, and the temperature in Fahrenheit on Holding Register 2. Each register has a required "Length" field as well. In this case, the data is stored in a single register, so the length is set to 1. As you read registers, an object is being built on the workflow payload with the value of each register stored on whatever you specified in the Result Key field.
The last configuration section is the Destination Path. This is where the final result object, with each key specified by the registers, will be placed on the payload. So in this example, an object with three keys (humidity, tempC, and tempF) will be put on the payload at working.modbus. The value at each key will be an array equal to the length configured for that register.
{
  "working": {
    "modbus": {
      "humidity": [5859],
      "tempC": [111],
      "tempF": [855]
    }
  }
}
Test Deployment
At this point, no data is being sent to the cloud, but this is a good time to deploy and test that this workflow is properly reading Modbus data. Click the Save button on the top right of the screen and then click the Deploy button.
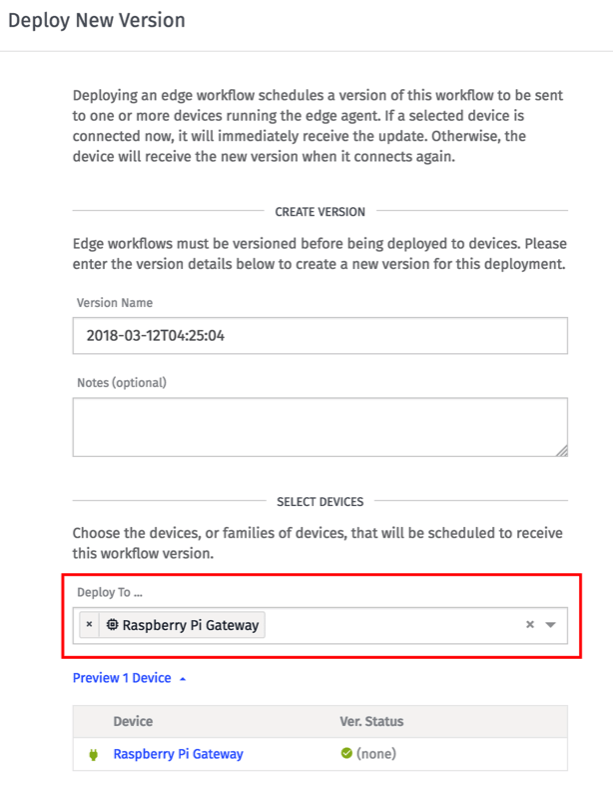
Losant keeps track of every version of every workflow deployed to Edge Compute devices. This means a workflow must first be versioned before it can be deployed. This popup provides a quick way to version this workflow, which defaults to the current date and time in UTC. You can change it to whatever you'd like. You next need to choose which Edge Compute devices to deploy this workflow version to. Choose the Edge Compute device you created earlier in this walkthrough. Click the Deploy Version button to schedule this deployment.
Under normal conditions and if your device is currently connected, a workflow version will be successfully deployed to an Edge Compute device in a matter of a few seconds. You can monitor the process by clicking the Devices tab on the menu along the right side of the screen.
After the deploy completes, open the Debug tab and select your Edge Compute device from the dropdown. This will allow you to stream any debug information from that device to your browser. You can use this to verify that your Modbus read operations are working correctly.
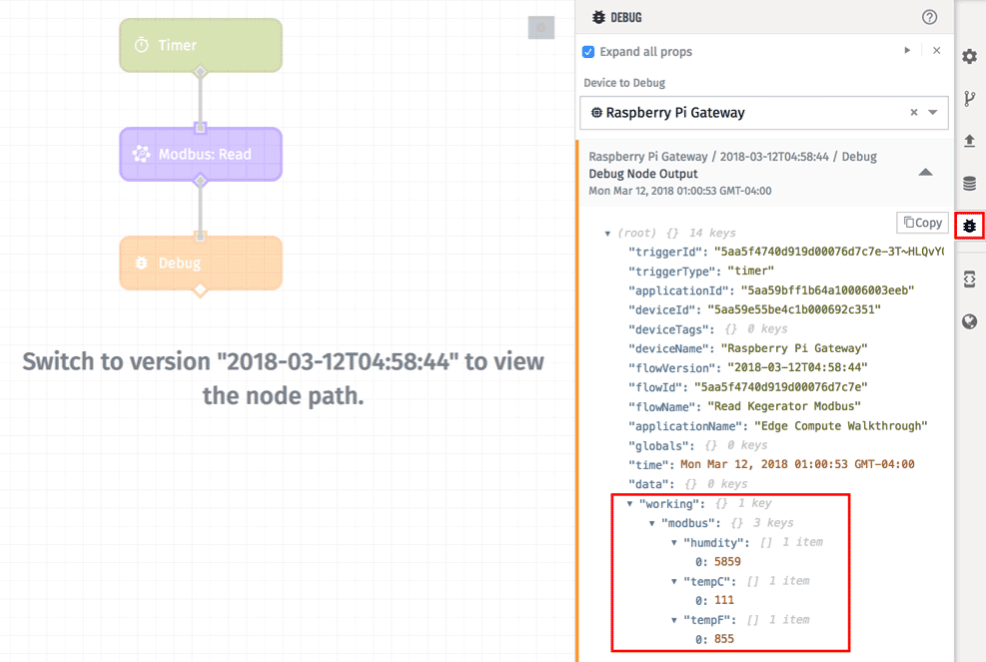
When you hover over a debug message, a notice will show up over the canvas area instructing you to switch versions to see the "node path". This is because you're currently viewing the develop version of the workflow, but you just created and deployed a different version to the edge device. The "node path" is a helpful visual indicator to know which path in the workflow was taken to reach the Debug Node that generated whatever message you're currently hovering over. Since workflows can change drastically between versions, you'll have to be viewing the same version that generated the debug message in order to highlight the path. If you want to check it out, you can switch versions by clicking the Versions menu on the right side of the screen.
Since it looks like this workflow is successfully reading Modbus data, we can continue editing the workflow to translate the values and report them to the cloud.
Information stored in Modbus registers is not always in a friendly format. Below is the table from the Banner temperature sensor that describes how the data is stored and how it translates to actual values.

Convert Values
As you can see, we're getting a value between 0 and 10000 for humidity, and between -32768 and 32767 for Celsius and Fahrenheit. So in order to convert these to actual values, we need to divide humidity by 100 and divide the temperatures by 20. These values were found by dividing the raw range by the actual range. So for humidity, the raw range is 0 to 10000, which translates to an actual range of 0 to 100. 10000 divided by 100 gives us our conversion factor of 100.
Fortunately, this is easily done with a Math Node.
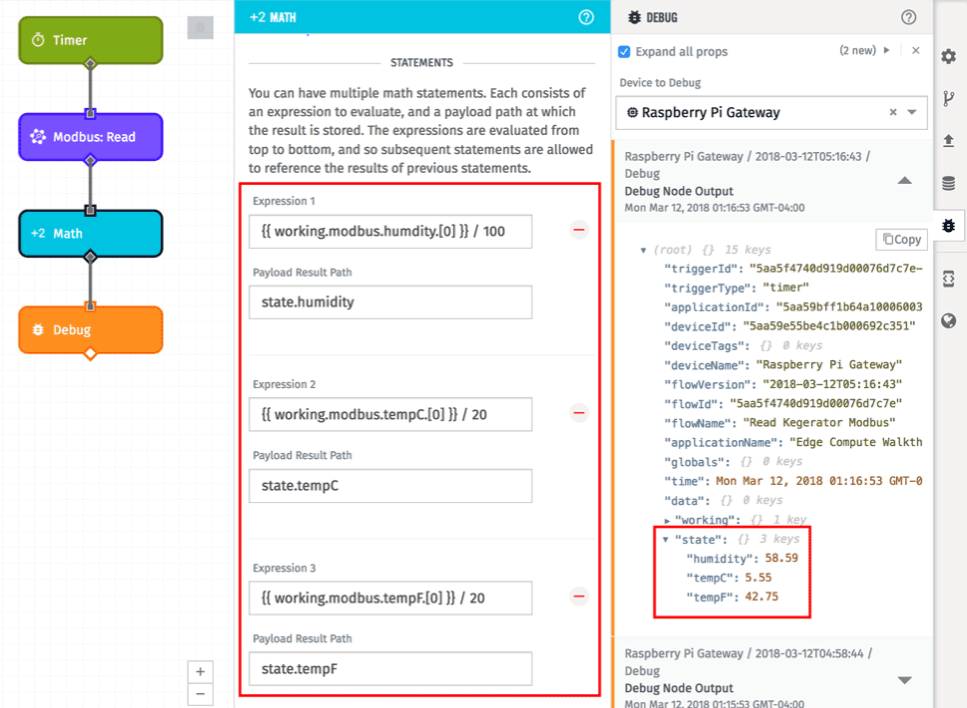
Add three expressions, one for each conversion, to the Math Node.
1. {{ working.modbus.humidity.[0] }} / 100

2. {{ working.modbus.tempC.[0] }} / 20

3. {{ working.modbus.tempF.[0] }} / 20
Each expression uses a template to reference the raw value and then divides them by the appropriate conversion factor. The result of each expression is then put back on the payload at state.humidity, state.tempC, and state.tempF. Once you save and deploy this workflow, you can see these converted values in the debug output.
Report State
The last step is to report these converted values to our kegerator peripheral. Add a Device State Node to do this.
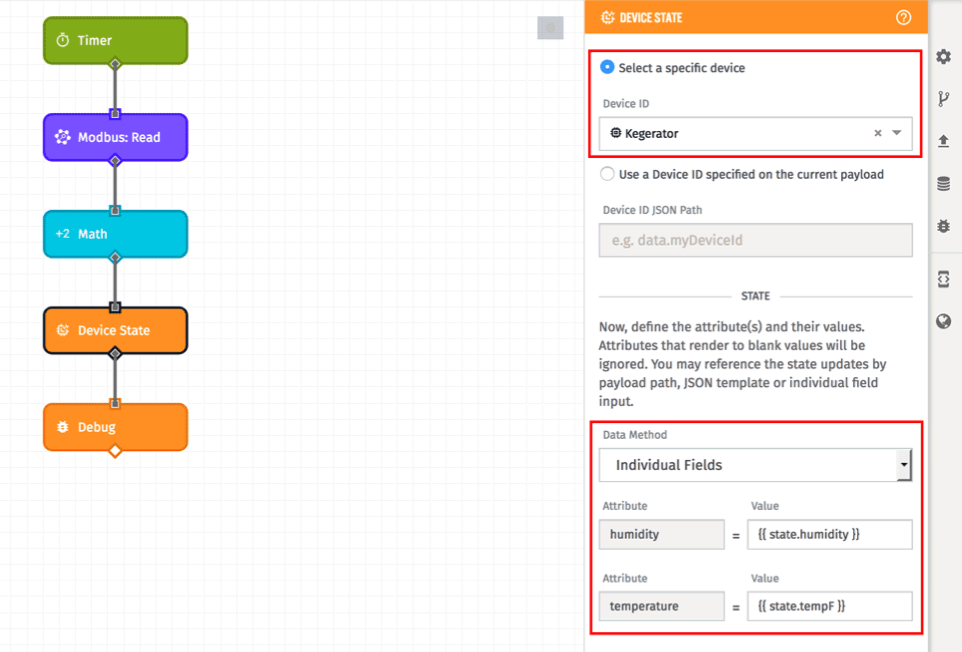
Change the radio to Select a specific device and choose the peripheral device created earlier. In this example, the peripheral device is named "Kegerator".
This device has two attributes, one for humidity and one for temperature. Set the humidity value to {{ state.humidity }} and set the temperature value to {{ state.tempF }}. In this example, the temperature in Celsius won't be reported to the cloud, however you could add additional nodes to perform more edge processing on the Celsius data if you'd like. After you save and deploy this workflow again, data is now being reported from your edge device to the cloud. You can verify this by opening the Debug tab on your peripheral device page.
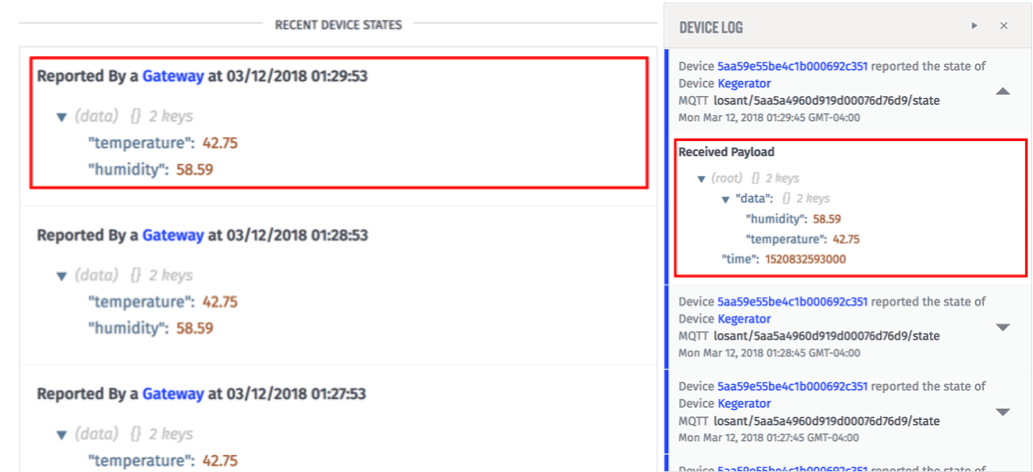
The device's debug tab allows you see recent state messages reported by this device. You can also view real-time activity by inspecting the Device Log, which is on the right side of every device tab.
At this point, you've successfully deployed a working Edge Compute device that reads local Modbus data over TCP, performs some processing on that data, and then reports it to the cloud. You can now trigger an application workflow for further processing or alerting, build a dashboard to visualize this data, or use Application Experiences to create an entire custom interface for your end users.
Was this page helpful?
Still looking for help? You can also search the Losant Forums or submit your question there.