Workflow Metrics
Workflow Metrics provide high-level overview statistics about the usage and performance of a workflow, as well as a record of any critical errors registered by your workflow runs. The information found within this tab can be useful for debugging nodes and identifying integrations with third-party services that may be timing out.
Workflow Metrics are not available for Embedded Workflows.
Note: Workflow Metrics do not update in real time. Rather, they are aggregated and reported approximately every 15 minutes.
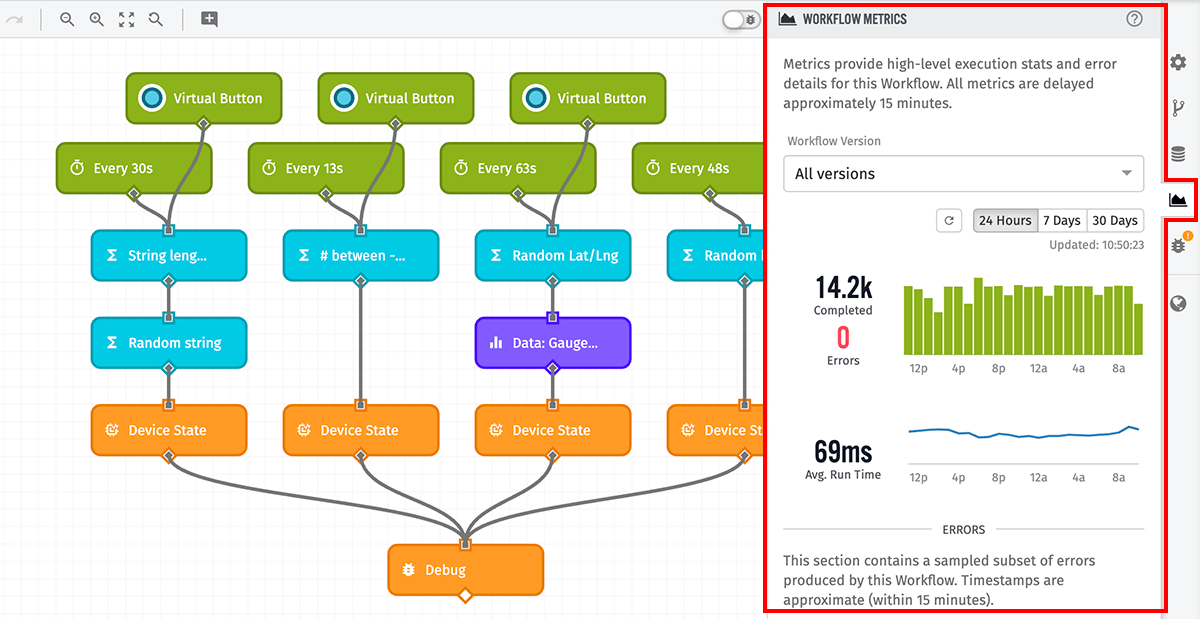
Viewing Workflow Metrics
From the Workflow Editor, click the "Metrics" tab in the right column to display the Workflow Metrics panel.
Configuration Options
By default, the Metrics tab displays statistics across all versions for the past 24 hours, but these settings can be changed:
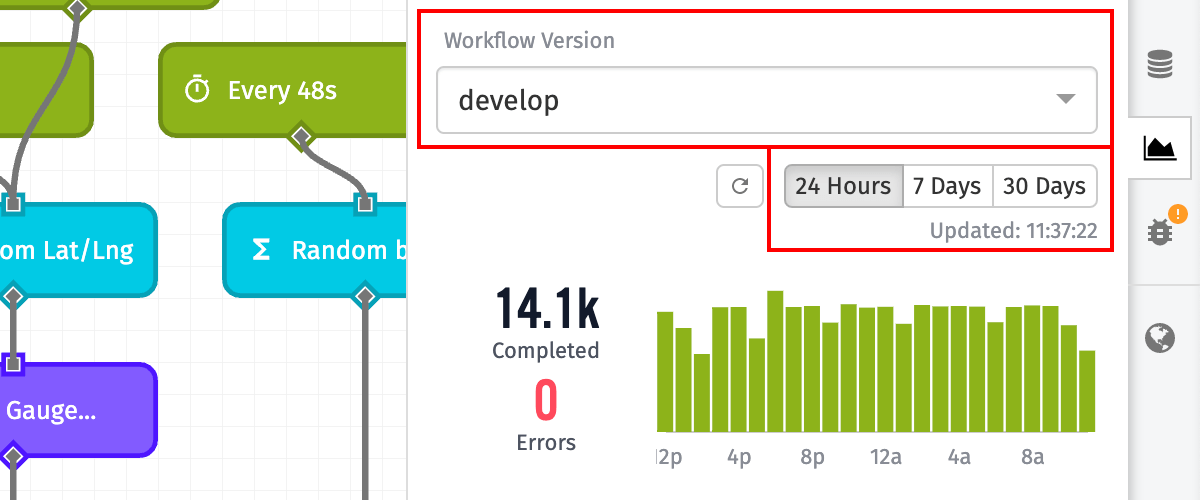
- Workflow Version: For Application Workflows, Experience Workflows, and Custom Nodes, you may choose to view metrics for all Workflow Versions or for specific versions.
- Device: For Edge Workflows, you may view the metrics for the given workflow on a specific Edge Compute Device. This includes all versions of the workflow that have run on the device in the chosen timeframe.
- Timeframe: Choose whether to display metrics for the past 24 hours, the past 7 days, or the past 30 days.
Workflow Run Statistics
There are several different statistics available when viewing a workflow's given metrics.
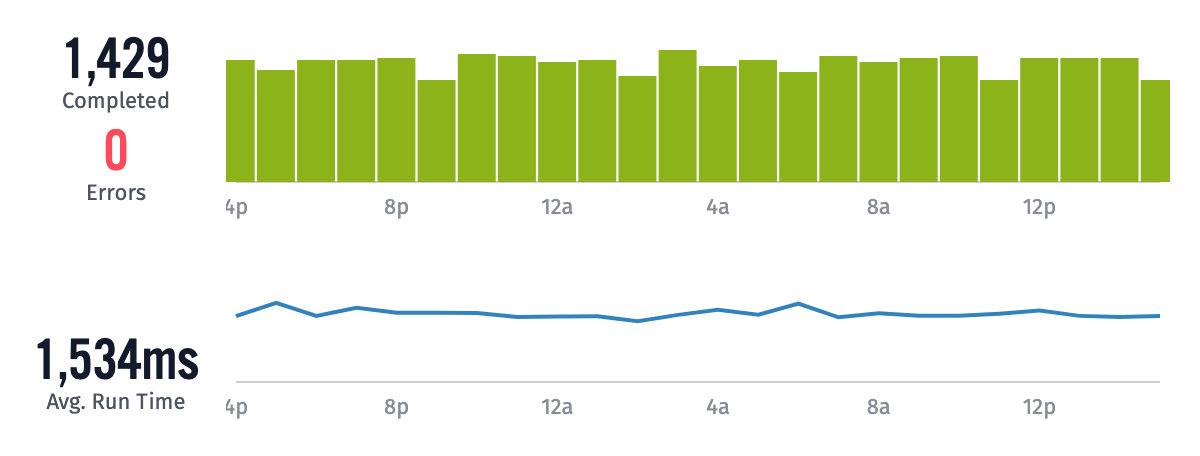
Paths Completed
This is the number of final nodes in a workflow that is reached without any execution errors. For example, given one execution of a workflow via a trigger, the workflow itself may branch out to multiple paths from any node output. Each of these branches, if successfully executed to completion, would count as one "Path Completed."
Every workflow execution counts as at least one "Path Completed," even if the trigger that started the workflow does not connect to any other nodes. If your workflow branches in multiple directions from any node output, one execution can also lead to multiple "Paths Completed" per run.
Paths Failed
Any branch of a workflow that encounters an uncaught error results in a "Path Failed." For example, if your workflow includes a MongoDB Node configured to "Error the Workflow" when the operation fails, and a template provided for the "Connection URI" resolves to an invalid value, that will log in the metrics as a "Path Failed." Any nodes that follow the MongoDB Node will not run, and their paths will not count toward your workflow's "Paths Completed."
A "Path Failed" can also be encountered by invoking a Throw Error Node, which halts the execution of the path at that point and treats the invocation of the node as any other uncaught exception within the error metrics.
Similar to how "Paths Completed" is calculated, one workflow execution can lead to multiple "Paths Failed" if the workflow branches out to multiple paths and those paths each encounter a workflow-stopping error.
Average Run Time
The Average Run Time is calculated by dividing a workflow's "Wall Time" by its "Run Count."
"Wall Time" is defined as the number of milliseconds between a trigger firing and the last to complete node that connects back to the trigger, regardless of if that node completed or failed. In the case of failure, the nodes connected to the node in question will never fire and are thus not included in any "Wall Time" calculation.
"Run Count" is defined as the number of times a workflow trigger fires. For example, a device reporting state 10 separate times will cause a Device State trigger to fire 10 times, leading to a "Run Count" of 10. If your workflow does not have any cases where multiple nodes branch off of a single node output, "Run Count" would also be the sum of "Paths Completed" and "Paths Failed" over the same time period.
The biggest driver of changes in "Average Run Time" is connections to third-party services through the HTTP Node, the Azure: Function Node, the GCP: ML Node, and many others. If those services are experiencing slowdowns or are unavailable, expect the Average Run Time to increase significantly.
Statistics Examples
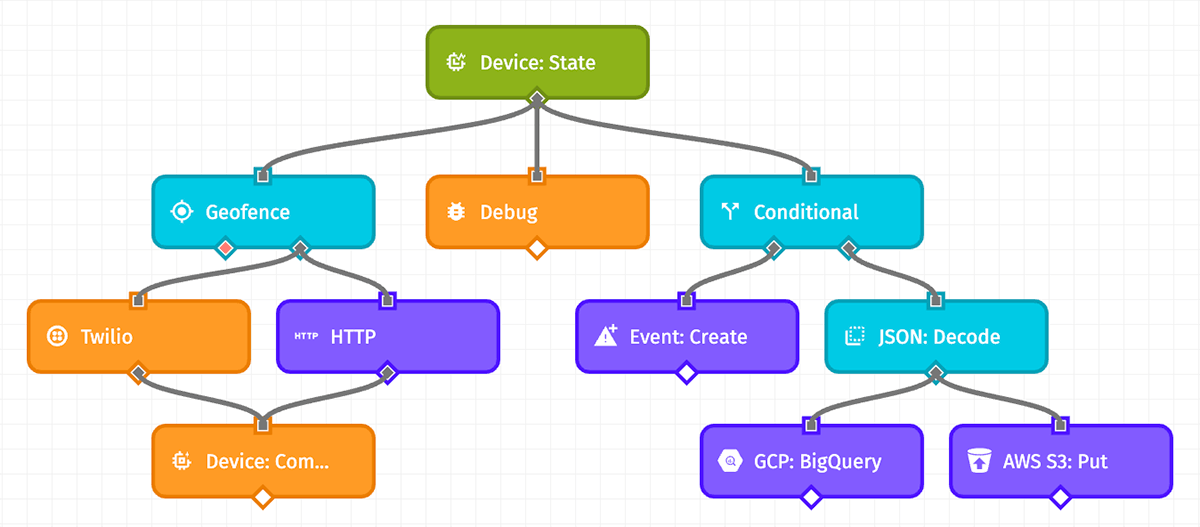
Use the workflow in the screenshot below as an example for calculating the various statistics. These calculations are based on a single execution of the workflow: a device reports state, which causes the Device: State Trigger to fire one time.
Maximum Paths Completed Without Errors
Given the following conditions:
- All nodes complete successfully without timing out the workflow.
- The Geofence Node follows its "true" path.
- The Conditional Node follows its "true" path.

This leads to 5 Paths Completed at the following nodes:
- The Debug Node, while not connecting to any other nodes nor following any nodes other than the trigger, still counts as a completed path.
- The Device: Command Node fires after the Twilio Node.
- The Device: Command Node fires again, this time from the HTTP Node. Though the Twilio and HTTP Nodes connect to the same Device: Command Node, the workflow splits out of the Geofence Node's "true" output, leading to two parallel executions. Because of this, the Device: Command Node actually runs twice, once for each of the branches leading into it.
- The GCP: Big Query Node runs off a branch from the JSON: Decode Node.
- The AWS S3: Put Node also runs off a branch from the JSON: Decode Node. It runs in parallel with the GCP: Big Query Node.
Minimum Paths Completed Without Errors
Given the following conditions:
- All nodes complete successfully without timing out the workflow.
- The Geofence Node follows its "false" path.
- The Conditional Node follows its "false" path.

This leads to 3 Paths Completed at the following nodes:
- The Geofence Node becomes the last node in its path since no nodes follow it through its "false" output.
- The Debug Node counts again, as described above.
- The Event: Create Node runs from the Conditional Node's "false" output.
Counting Paths Failed
Given the following conditions:
- The Geofence Node follows its "true" path.
- The Conditional Node follows its "true" path.
- The HTTP Node encounters an error, but it is configured to store the error on the payload.
- The JSON: Decode Node encounters an error, and it is configured to error the workflow.
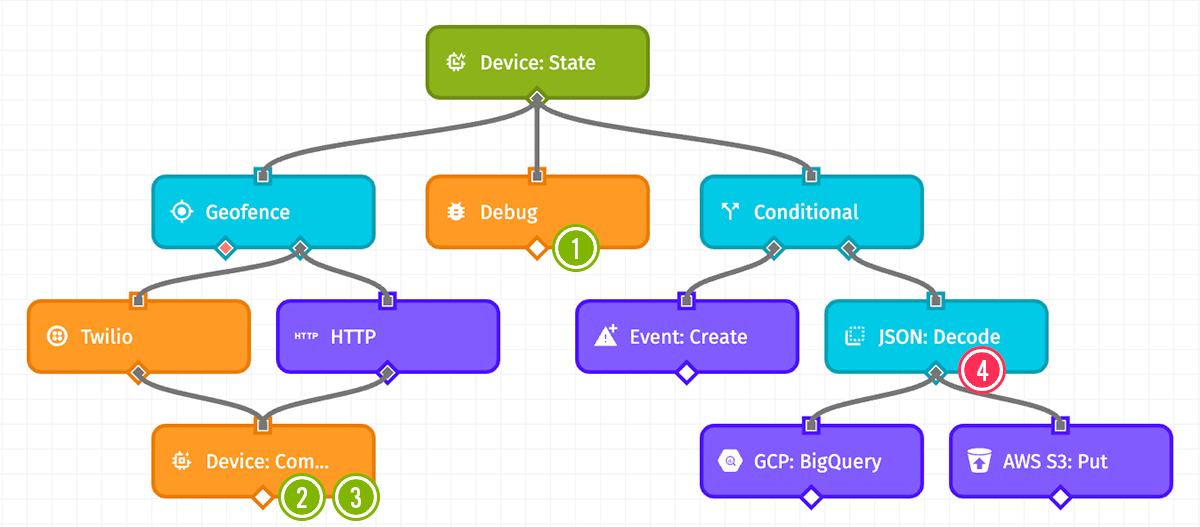
This leads to 3 Paths Completed and 1 Path Failed at the following nodes:
- The Debug Node fires immediately as a branch straight off the trigger.
- The Device: Command Node fires after the Twilio Node.
- The Device: Command Node fires again, after the HTTP Node. Though the HTTP Node encountered an error, it is configured to store the error on the payload and continue running the workflow, which allows the Device: Command Node to execute.
- The JSON: Decode Node error causes that branch of the workflow execution to fail, which results in no paths completed after the Conditional Node. Furthermore, the GCP: BigQuery and AWS S3: Put Nodes do not complete because of the failure preceding them. This leads to a "Path Failed" in the workflow metrics.
Workflow Errors
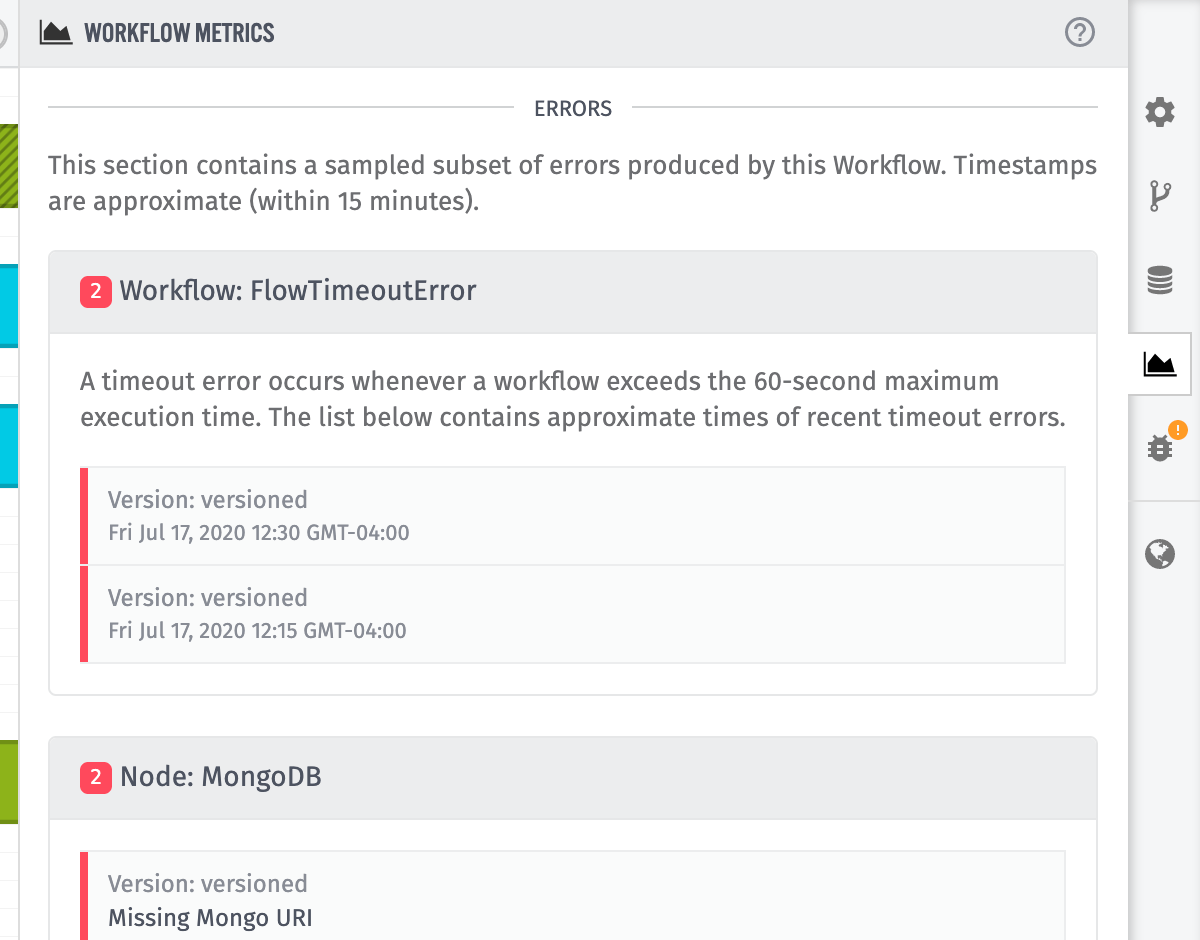
Any node execution that results in a "Path Failed" as described above leads to an error appearing within the "Errors" section of the Workflow Metrics tab.
The errors displayed within the "Errors" section are just a sampling of errors registered by your workflow within the chosen time period. The metrics return a maximum of 25 errors; it is possible that additional instances of a given error also occurred, or that additional errors in other nodes occurred within the time period.
Node Error Grouping
Within the "Errors" section, nodes are grouped by ID. Within one node group, you may find multiple instances of the same error, or instances of different errors thrown by the same node.
To that end, if your workflow contains two separate HTTP Nodes, and each node causes errors, you will see two separate groups within the "Errors" section: one for each of your HTTP Nodes.
Nodes are also grouped across versions. For example, if an HTTP Node in your workflow's "develop" version equates to the same node (by ID) in another version of the workflow, and both versions throw errors on the node, you will see instances of the errors from both versions when requesting stats across all versions/devices.
When a node is deleted, the errors thrown by that node will remain within the "Errors" section. However, the node's name in the group header will be replaced by a reference to the node ID.
Workflow-Level Errors
If any errors occurred within the workflow run that were not the result of a specific error, those will appear at the top of the list of errors. It is possible to encounter "Workflow Timeout" errors if, for example, a node that calls a third-party service does not receive a response before the workflow's maximum 60-second run time. Timeout errors, when prevalent, will have a major impact on your workflow's "Average Run Time."
In practice, timeouts are the only workflow-level error you are likely to encounter, though there are rare cases where you may find other such errors.
Was this page helpful?
Still looking for help? You can also search the Losant Forums or submit your question there.