Custom HTML
The Custom HTML Block is an advanced block that allows you to create data visualizations using your own custom HTML, CSS, and JavaScript. With this block, you have full control over the representation of your data, and can create almost any kind of visualization using third-party libraries and/or custom code.

Configuring the Custom HTML Block is broken up into two sections:
Queries

All query types include a Query Name property, which is how each individual query's data is referenced in the data given to your block's JavaScript code.
A Query Result section will appear at the bottom of each segment allowing you to see the data returned by the query.
Time Series Queries
Time Series Queries provide a dataset that includes the values of a single attribute (aggregated across one or more devices) over a given duration and resolution. The values returned from the query are returned as an array of objects in the form of:
[
  { "time": <time>, "value": <value> },
  { "time": <time>, "value": <value> },
  { "time": <time>, "value": <value> }
]
The values returned will reflect the selected attribute's aggregated value at that resolution bucket. This is the same data that is used in the Time Series Block.

The parameters of the Time Series Query include:
- Query Name is what will be referenced in your block's JavaScript code.
- Device is a device query for selecting device(s) for which to return aggregated data.
- Duration is how far into the past you want to look at the data. This defaults to the global dashboard duration.
- Resolution is how your data will be grouped. These options will change based on what you specify for the duration. This defaults to the global dashboard resolution.
- Attribute is the device attribute whose value will be returned in the query. Note that if data from more than one device is being displayed, each of those devices must supply the same attribute name.
- Aggregation determines how all the available data returned should be aggregated before being returned. This defaults to "Last".
Gauge Queries
Gauge Queries allow you to query a single attribute aggregated across one or more devices. You can choose to return either the last reported value of the attribute or the value from a selected aggregation over a selected duration of time.
This query returns an object in the form of { "time": <time>, "value": <value> }, where value is the data of the attribute after the selected aggregation has been performed, and time is the timestamp corresponding to that value.

The parameters of the Gauge Query include:
- Query Name is what will be referenced in your block's JavaScript code.
- Device is a device query for choosing which device(s) to return aggregated data for.
- Duration is how far into the past you want to query for data. This defaults to the last received data point (relative to the dashboard end time).
- Attribute is the device attribute whose value will be returned in the query. Note that if data from more than one device is being displayed, each of those devices must supply the same attribute name.
- Aggregation determines how all the available data returned should be aggregated before being returned. This defaults to "Last".
Data Table Queries
Data Table Queries allow you to query any data that is stored in a data table. The data table query returns an array of your data table rows where the column names are the keys you will reference in JavaScript. Losant automatically generates a list of columns that are available to query as well as all default row data.

The parameters of the Data Table Query include:
- Query Name is what will be referenced in your block's JavaScript code.
- Data Table is the table that you're querying.
- Query is a query built the same way as in the Table: Get Rows Node, where an array of individual queries can be joined with an "OR" or "AND" operator.
- Sort Column Template is the column on the data table to sort by. By default, this field is
id. The following are the valid sort fields:id,createdAt,updatedAt, as well as any custom columns on the table. This field is templatable. - Sort Direction Template is the direction the sort column sorts in. By default, this field is
asc. The valid sort directions areascanddesc. This field is templatable. - Offset Template is the number of results to skip, allowing you to paginate through large numbers of rows. If provided, this must be a non-negative integer; the default is
0. This field is templatable. - Limit Template is the maximum number of rows to return with one query. If provided, this must be an integer between
0and10000. The default is1000. This field is templatable.
Device Info Queries
Device info queries allow you to query device metadata including device names, descriptions, attributes, tags, and optionally connection info and attribute composite states. The device info query will be added under the queries key in the form of:
{
  "device-info-0": { // Name given in the Query Name field
    "count": 10, // The number of devices returned
    "items": [...], // The resulting devices from the query
    "applicationId": "5a67b4d91d5531000772e755",
    "perPage": 10,
    "page": 0,
    "sortField": "name",
    "sortDirection": "asc",
    "totalCount": 15, // The total number of devices matched by the query
    "_type": "devices"
  }
}
Each device object inside the items array will be in the form of:
{
  "deviceClass": "floating",
  "name": "Test Device",
  "tags": [
    {
      "key": "foo",
      "value": "bar"
    }
  ],
  "applicationId": "5a67b4d91d5531000772e755",
  "creationDate": "2021-02-10T23:37:41.385Z",
  "lastUpdated": "2022-06-07T02:37:30.071Z",
  "attributes": [
    {
      "name": "num",
      "dataType": "number",
      "attributeTags": {
        "s": "d"
      }
    }
  ],
  "_etag": "\"1ac-Ig5eB2pZ/XWMNKaFEvhNzHmTP14\"",
  "deviceId": "60246e459d64660006025152",
  "id": "60246e459d64660006025152",
  "connectionInfo": {
    "connected": null
  },
  "attributeValues": {
    "num": 42
  },
  "_type": "device"
}

The parameters of the Device Info Query include:
- Query Name is what will be referenced in your block's JavaScript code.
- Device Query is an advanced query for choosing which devices' metadata you want to access.
- Sort Field Template is the property on the devices to sort by. By default, this field is
name. The following are the valid sort fields:name,id,creationDate, orlastUpdated. This field is templatable. - Sort Direction Template is the direction the sort field sorts in. By default, this field is
asc. The valid sort directions areascanddesc. This field is templatable. - Page Template is the number of results to skip by multiplying this number by the
Per Page Templatefield, allowing you to paginate through large numbers of devices. If provided, this must be a non-negative integer; the default is0. This field is templatable. - Per Page Template is the maximum number of devices to return with one query. If provided, this must be an integer between
0and1000. The default is25. This field is templatable. - Include Connection Status allows you to enable or disable device connection info being returned in the query.
- Composite State To Include determines if the last known state attribute values will be included for each device. These will be added to the device object under the
attributeValueskey. The valid options for this are:Include no attributes: This is the default, and means no composite state will be returned.Include all attributes: This will return composite state for every attribute on the device.Include the following attributes: This will return composite state for the specifically selected attributes set in theSelect Attributesfield.
- Select Attributes determines which attributes to return composite states for when the
Composite State To Includefield is set toInclude the following attributes.
Event Queries
Event queries allow you to query Events generated through your application logic. The event query will be added under the queries key in the form of:
{
  "events-0": { // Name given in the Query Name field
    "_type": "events",
    "applicationId": "5a67b4d91d5531000772e755",
    "count": 10, // The number of events returned
    "items": [...], // The resulting events from the query
    "page": 0,
    "perPage": 10,
    "query": {...}, // the query resulting in the returned events
    "sortField": "subject",
    "sortDirection": "asc",
    "totalCount": 15 // The total number of events matched by the query
  }
}
Each event object inside the items array will be in the following form, with some only properties present depending on the block configuration as described below:
{
  "_type": "event",
  "id": "680aa046d6946472ddd52048", // unique ID of the event
  "applicationId": "5a67b4d91d5531000772e755", // ID of the application
  "creationDate": "2025-04-24T20:34:14.833Z", // date-time the event was created
  "lastUpdated": "2025-05-27T17:06:12.273Z", // date-time the event was last updated
  "level": "critical", // the level assigned to the event on creation ("critical", "error", "warning", or "info")
  "state": "acknowledged", // the event's current state ("new", "acknowledged", or "resolved")
  "subject": "Temperature high", // subject assigned to the event on creation
  "eventTags": { // key-value mapping of event tags, which can change over the lifecycle of the event
    "tagKey": "tag value"
  }
}
In addition to the properties above, each event object will also contain the following properties if the user viewing the dashboard has application permissions or if the "Include extended info" box is checked in the segment configuration ...
{
  "data": { // additional JSON data provided on event creation, if applicable
    "temp": "109"
  },
  "deviceId": "60b8ec6155944a000699e77f", // ID of the device associated with the event, if applicable
  "deviceName": "Temp Sensor", // name of the device associated with the event, if applicable
  "eventId": "680aa046d6946472ddd52048", // unique ID of the event, equal to the "id" property
  "message": "Temp recorded at 109", // event description provided on creation
  "sourceId": "56c7420e63b022010029fabc", // ID of the entity that created the event, be it a workflow, user, etc.
  "sourceName": "Temp Alerts", // name of the entity that created the event
  "sourceType": "flow", // type of entity that created the event ("user", "apiToken", or "flow")
  "updates": [ // an array of updates applied to the event over time, if applicable ...
    {
      "comment": "Faulty sensor suspected", // comment provided with the update
      "creationDate": "2025-05-27T17:06:12.271Z", // date-time of the event update
      "sourceId": "56c7420e63b022010029fcd3", // ID of the entity responsible for this update
      "sourceName": "support@losant.com", // name of the entity responsible for this update
      "sourceType": "user", // type of the entity responsible for this update ("user", "apiToken", or "flow")
      "state": "acknowledged", // state of the event after the update
      "stateChange": {
        "new": "acknowledged", // state of the event after the update
        "old": "new" // state of the event prior to the update
      }
    }
  ]
}

The parameters of the Event Info Query include:
- Query Name is what will be referenced in your block's JavaScript code.
- Events Query is an advanced query for choosing which events you want to access.
- Sort Field Template is the property on the events to sort by. By default, this field is
creationDate. The following are the valid sort fields:id,subject,level,creationDate, orlastUpdated. This field is templatable. - Sort Direction Template is the direction the sort field sorts in. By default, this field is
desc. The valid sort directions areascanddesc. This field is templatable. - Page Template is the number of results to skip by multiplying this number by the
Per Page Templatefield, allowing you to paginate through large numbers of events. This number must be greater than 0, and the default is0. This field is templatable. - Per Page Template is the maximum number of events to return with one query. The max number of events that can be returned at once is 1000. The default is
25. This field is templatable. - Include extended event info for public and experience users, if checked, returns additional information about each event as described above.
HTML Configuration

Once you have built your queries, provide the custom HTML, CSS, and JavaScript to create your block. This is split into a "Custom Head Content" section (which will be placed within the document's <head>) and a "Custom Body Content" section (which will be placed within the document's <body>).
Losant uses this content to create a full HTML document that is then passed as the srcdoc attribute to an inline frame (<iframe>) in the dashboard block. Additional code is appended to the <head> section to allow for subscribing to events, exposing methods, loading common platform fonts, and applying some CSS style resets.
The <iframe> renders with the following value for the sandbox attribute:
allow-scripts allow-forms allow-popups allow-popups-to-escape-sandbox allow-top-navigation-by-user-activation allow-downloads
The page contents are only loaded a single time when the dashboard is initially displayed. In order to receive your query data and react to updates, your page must include JavaScript that listens to special events that Losant provides.
Subscribing to Events
Within the scope of the block, there is a global DashboardBlock JavaScript object that exposes several events, which can be subscribed to from your custom JavaScript in order to receive your query data (among other things). You can subscribe to events using the following syntax ...
DashboardBlock.on('eventName', myCustomFunction);

// where myCustomFunction is a function with a single argument ...
function myCustomFunction(e) {
  console.log(e);
}
... where eventName is one of the emitted events described below, and myCustomFunction is the name of a JavaScript function defined in the block (or is replaced with an anonymous function).
Note: You may also unsubscribe from events by calling the following within your block's code:
DashboardBlock.removeListener('eventName', myCustomFunction);
Event Types
All events are emitted on the initial block load and then again whenever the specific action occurs. The DashboardBlock object emits the following events:
ctxChange: Emitted whenever any dashboard context variable changes.customEvent: Emitted whenever a Custom HTML Block calls theDashboard.emitCustomEvent()method (including the block that emitted the event).durationChange: Emitted whenever the user changes the dashboard's duration.queryChange: Emitted whenever new query results are available.resize: Emitted whenever the block size changes.resolutionChange: Emitted whenever the user changes the dashboard's resolution.themeChange: Emitted whenever the user changes the dashboard's theme.timeChange: Emitted whenever the current dashboard's time value changes.tooltipChange: Emitted whenever a tooltip shows, hides, or changes position in a time series graph; or when a Custom HTML Block calls theDashboard.setTooltipState()method. (Note: This event must be opted in to by selecting the "Subscribe totooltipChangeevents" checkbox.)change: A catch-all event that is also emitted on any of the above events.
Event Arguments
All events provide a single argument to the function they invoke: an object containing all of the following properties (unless otherwise noted ...)
blockId: The unique ID of this dashboard block within the current dashboard.ctx: An object with keys for each of your dashboard's context variables, and values representing the current value of each variable. The shape of each value depends on the type of context variable and the options applied to it.dashboard: An object with the following properties ...duration: The currently selected dashboard duration, in milliseconds since Epoch.id: The ID of the current dashboard.name: The name of the current dashboard.refreshRate: The rate at which the dashboard refreshes data, in seconds.resolution: The currently selected dashboard resolution, in milliseconds since Epoch.themeName: The current theme of the dashboard ("light" or "dark").time: The past state time of the dashboard, or the time at which data was last fetched, in milliseconds since Epoch.viewContext: The environment in which the dashboard is currently being rendered ("platform", "embeddedBlock", "embeddedDashboard", "experience", or "report").
customEventData: This property is only present in response to thecustomEventevent. (See the note on persisting this data below.) The shape of the value depends on the value provided when calling theDashboard.emitCustomEvent()method.queries: An object whose properties correspond to the names of all queries defined on the block. The shape of each property's value depends on the query's data type.size: An object containing the following properties ...height: The current height of the dashboard block in pixels.width: The current width of the dashboard block in pixels.
tooltip: An object that updates in response to thetooltipChangeevent, which users must opt in to as described above. It contains the following properties ...isActive: A boolean indicating whether a tooltip is being displayed.time: The timestamp, in milliseconds since Epoch, corresponding to the data point associated with the tooltip. The property is only defined iftooltip.isActiveistrue.
Accessing Data Outside Events
On every event described above, the callback value is written to the global DashboardBlock.input property, which can be accessed outside of emitted events. This object will persist until another event is triggered, regardless of if you are subscribing to the event that caused the update.
Persisting customEventData
Data provided through the customEvent event is only persisted to the customEventData property on DashboardBlock.input until another event fires within the block; for this reason, block developers should persist data from these events to a local variable like so ...
let lastEventData;
DashboardBlock.on('customEvent', function(e) {
  lastEventData = e.customEventData;
});

// lastEventData can now be accessed in other event callbacks
DashboardBlock.on('queryChange', function(e) {
  console.log('lastEventData', lastEventData);
});
Emitting Events
The global Dashboard object (not to be confused with the global DashboardBlock object) exposes the following methods that can be called from your block's code:
fetchData(): Triggers a dashboard data refresh. If the dashboard includes any experience user context variables or device ID context variables with the "Include full device info" option selected, this method will also re-fetch those variable values.setTooltipState(state): Forces the tooltip state of any time series graphs, and also emits thetooltipChangeevent in any Custom HTML Blocks that have opted in and subscribed to the event. (The block emitting the event does not have to opt in to the event to emit this.) Thestatevalue must be an object with the following properties ...isActive: A boolean indicating whether a tooltip should be displayed.time: The timestamp, in milliseconds since Epoch, corresponding to the data point associated with the tooltip. This value must be provided ifisActiveistrue.
emitCustomEvent(data): Emits thecustomEventevent in all Custom HTML Blocks within the dashboard. Thedataargument is optional and, if provided, can take any shape; it is exposed to subscribed blocks under thecustomEventDataproperty of the event arguments.
Generating Code Suggestions
To assist dashboard developers, Losant exposes an AI-powered service that accepts a prompt and, in combination with the block's queries returns <head> and/or <body> content for use in the Custom HTML Block. The model backing the code generator is trained on millions of lines of code from a variety of general-purpose use cases, and can utilize third-party graphing libraries such as Chart.js and Google Charts to generate custom visualizations.
Requesting a Code Suggestion
To generate a function, first configure the block's queries to return the data you would like to visualize in the block. This is essential to getting a valid code suggestion.
Then, click the "Request AI Code Generation" button above the "Custom Head Content" input. Doing so will display a modal where you may enter a prompt. Be as descriptive as possible about what you would like the generated code to do. For example, "Create a line chart of temperature over time using Chart.js" is more descriptive than "Create a chart".
Once ready, click the "Generate Code Suggestion" button. The AI service will process your request and return a code suggestion that you can then review. This process can take several seconds.
Using the Suggested Code
Given a prompt and your configured queries, the code generation service will return some combination of the following:
- Comments for how to use the code and any other considerations to be aware of.
- Content for the "Custom Head Content" section of the block.
- Content for the "Custom Body Content" section of the block.

Beneath the output are two buttons:
- Replace Config with Suggestion: Pressing this will overwrite any current code in the "Custom Head Content" and "Custom Body Content" with the returned suggestion and will close the modal.
- Append Suggestion to Current Config: Pressing this will add the suggestion beneath any code that is currently in each content input and will close the modal.
If you are not satisfied with the result, click "Change Prompt" to try again with a different prompt. You can also close the modal and tweak the block's queries before trying again with another prompt.
Examples
The following are some examples of how to use the Custom HTML block to create various visualizations and interactions.
Simple Refresh Button
To add a simple data refresh button to your dashboard block, add the following to the "Custom Body Content":
<button onclick="Dashboard.fetchData()">Refresh</button>
Alternatively, you can trigger a data refresh in response to another event, such as a form submission ...
<form id="myForm">
  <button type="submit">Submit Form</button>
</form>

<script>
  const form = document.getElementById('myForm');
  form.addEventListener('submit', async (e) => {
    e.preventDefault();
    const data = new FormData(form);
    await fetch('https://example.com', {
        method: 'POST',
        body: formData,
      }
    );
    Dashboard.fetchData();
  });
</script>
tooltipChange Events

Given a Custom HTML Block with a time series query called timeSeries, and a time series graph with an identical query segment, you can sync tooltip events across the two using the following:
Example tooltipChange Events Head Content
<meta charset="UTF-8">
<link href="https://cdn.jsdelivr.net/npm/bootstrap@5.3.2/dist/css/bootstrap.min.css" rel="stylesheet" integrity="sha384-T3c6CoIi6uLrA9TneNEoa7RxnatzjcDSCmG1MXxSR1GAsXEV/Dwwykc2MPK8M2HN" crossorigin="anonymous">
Example tooltipChange Events Body Content
<ul class="list-group list-group-flush" id="timeSeriesList">
  <!-- list items will be populated with JavaScript -->
</ul>

<script>
  const timeSeriesList = document.getElementById('timeSeriesList');
  const dateFormat = new Intl.DateTimeFormat('en-US', { dateStyle: 'medium', timeStyle: 'medium' });
  // render the data
  DashboardBlock.on('queryChange', (e) => {
    timeSeriesList.innerHTML = '';
    (e.queries.timeSeries || []).forEach(({ time, value }) => {
      const node = document.createElement("li");
      node.id = new Date(time).valueOf();
      node.classList.add('list-group-item');
      const date = new Date(time);
      const textNode = document.createTextNode(`${dateFormat.format(date)}: ${value}`);
      node.appendChild(textNode);
      timeSeriesList.appendChild(node);
    });
  });
  // push hovers up
  timeSeriesList.addEventListener('mouseover', (e) => {
    if (e.target.className === 'list-group-item') {
      Dashboard.setTooltipState({
        isActive: true,
        time: Number(e.target.id)
      });
    }
  });
  timeSeriesList.addEventListener('mouseleave', (e) => {
    Dashboard.setTooltipState({
      isActive: false
    });
  });
  // respond to hovers elsewhere
  DashboardBlock.on('tooltipChange', (e) => {
    timeSeriesList.querySelectorAll('.list-group-item').forEach((el) => {
      if(Number(el.id) === e.tooltip?.time) {
        el.classList.add('list-group-item-primary');
      } else {
        el.classList.remove('list-group-item-primary');
      }
    });
  });
</script>
Custom Events
Given two Custom HTML Blocks, activity within one block can trigger changes in the other block through custom events. The source block invokes the Dashboard.emitCustomEvent() method, and the destination block receives that update through the DashboardBlock.on('customEvent') event.
Source & Destination Block Head Content
<meta charset="UTF-8">
<link href="https://cdn.jsdelivr.net/npm/bootstrap@5.3.2/dist/css/bootstrap.min.css" rel="stylesheet" integrity="sha384-T3c6CoIi6uLrA9TneNEoa7RxnatzjcDSCmG1MXxSR1GAsXEV/Dwwykc2MPK8M2HN" crossorigin="anonymous">
<style>
  body {
    padding: 10px;
  }
</style>
Source Block Body Content
<div class="container-fluid">
  <p>Press one to tell the other block what your favorite color is.</p>
  <button class="btn btn-danger" data-variant="danger">Red</button>
  <button class="btn btn-warning" data-variant="warning">Yellow</button>
  <button class="btn btn-success" data-variant="success">Green</button>
  <button class="btn btn-primary" data-variant="primary">Blue</button>
  <div class="mt-3">
    <input type="text" id="input" class="form-control" placeholder="type in me!" />
  </div>
</div>
<script>
  document.querySelectorAll('button').forEach((el) => {
    el.addEventListener('click', (e) => {
      Dashboard.emitCustomEvent({
        favoriteColor: e.target.innerText,
        variant: e.target.dataset.variant,
        blockId: DashboardBlock.input.blockId
      });
    });
  });
  const inputEl = document.getElementById('input');
  inputEl.addEventListener('input', (e) => {
    Dashboard.emitCustomEvent({
      input: e.target.value
    });
  });
</script>
Destination Block Body Content
<div class="container-fluid">
  Favorite color: <span id="favoriteColor">(none)</span>
  <div>Input: <span id="input">(none)</span></div>
</div>
<script>
  const colorEl = document.getElementById('favoriteColor');
  const inputEl = document.getElementById('input');
  DashboardBlock.on('customEvent', (e) => {
    if (e.customEventData.favoriteColor) {
      colorEl.innerText = e.customEventData.favoriteColor;
      colorEl.className = `text-${e.customEventData.variant}`;
    }
    if (typeof e.customEventData.input !== 'undefined') {
      inputEl.innerText = e.customEventData.input || '(none)';
    }
  });
</script>
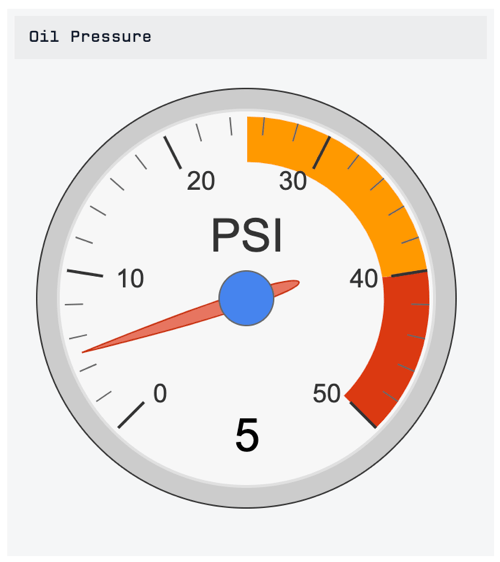
Using Google Charts
Example Google Charts Head Content
<script
  type="text/javascript"
  src="https://www.gstatic.com/charts/loader.js"
></script>
<script type="text/javascript">
  var googleLoaded = false
  var drawChart = function() {
    if (!googleLoaded) {
      return
    }
    var data = [['Label', 'Value']]
    if (DashboardBlock.input.queries.psi) {
      data.push(['PSI', DashboardBlock.input.queries.psi.value])
    }
    data = google.visualization.arrayToDataTable(data)
    var options = {
      width: DashboardBlock.input.size.width - 5,
      height: DashboardBlock.input.size.height - 5,
      redFrom: 40,
      redTo: 50,
      yellowFrom: 25,
      yellowTo: 40,
      minorTicks: 5,
      majorTicks: ['0', '10', '20', '30', '40', '50'],
      max: 50,
    }
    let chart = new google.visualization.Gauge(
      document.getElementById('chart_div')
    )
    chart.draw(data, options)
  }

  DashboardBlock.on('change', drawChart)

  google.charts.load('current', { packages: ['gauge'] })
  google.charts.setOnLoadCallback(function() {
    googleLoaded = true
    drawChart()
  })
</script>
Example Google Charts Body Content
<div id="chart_div"></div>
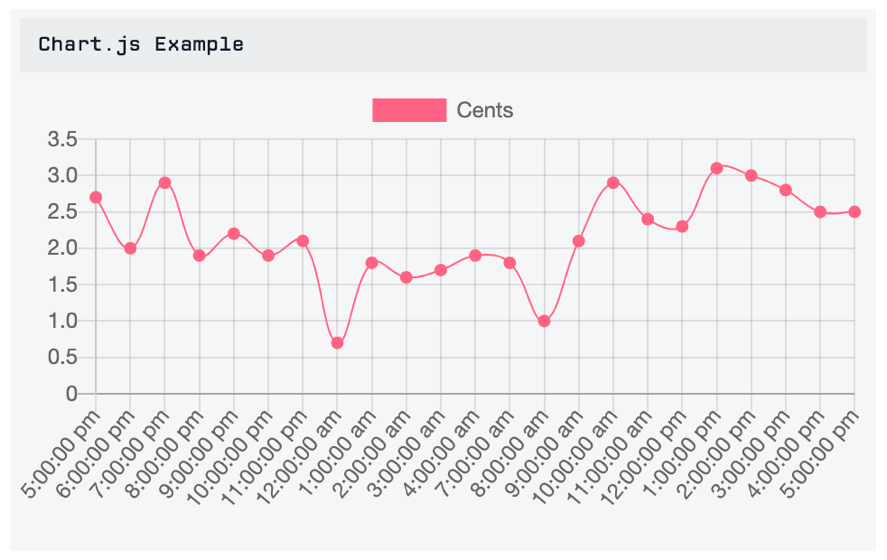
Using Chart.js
Example Chart.js Head Content
<script src="https://cdnjs.cloudflare.com/ajax/libs/Chart.js/2.8.0/Chart.min.js"></script>
<script src="https://cdnjs.cloudflare.com/ajax/libs/moment.js/2.24.0/moment.min.js"></script>

<script>
  var drawChart = function() {
    if (!DashboardBlock.input.queries.cents) return

    var data = DashboardBlock.input.queries.cents.map(function(point) {
      return point.value
    })
    var labels = DashboardBlock.input.queries.cents.map(function(point) {
      return moment(point.time).format('h:mm:ss a')
    })

    var ctx = document.getElementById('myChart').getContext('2d')
    var canvas = document.getElementById('myChart')

    canvas.width = DashboardBlock.input.size.width
    canvas.height = DashboardBlock.input.size.height
    var myChart = new Chart(ctx, {
      type: 'line',
      data: {
        labels: labels,
        datasets: [
          {
            label: 'Cents',
            data: data,
            backgroundColor: 'rgb(255, 99, 132)',
            borderColor: 'rgb(255, 99, 132)',
            borderWidth: 1,
            fill: false,
          },
        ],
      },
      options: {
        animation: false, // necessary for generating dashboard reports
        scales: {
          yAxes: [
            {
              ticks: {
                beginAtZero: true,
              },
            },
          ],
        },
      },
    })
  }
  DashboardBlock.on('queryChange', function(input) {
    console.log('queryChange', input)
  })
  DashboardBlock.on('change', drawChart)
</script>
Example Chart.js Body Content
<canvas id="myChart"></canvas>
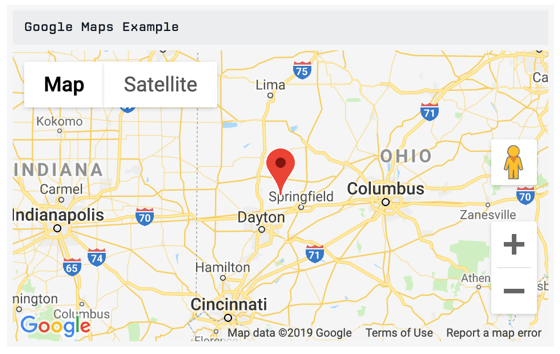
Using Google Maps
Example Google Maps Head Content
<title>Simple Map</title>
<meta name="viewport" content="initial-scale=1.0" />
<meta charset="utf-8" />
<style>
  /* Always set the map height explicitly to define the size of the div
   * element that contains the map. */
  #map {
    height: 100%;
  }
  /* Optional: Makes the sample page fill the window. */
  html,
  body {
    height: 100%;
    margin: 0;
    padding: 0;
  }
</style>
Example Google Maps Body Content
<div id="map"></div>
<script>
  var map
  function initMap() {
    var drawChart = function() {
      if (!DashboardBlock.input.queries.gps) {
        return
      }
      var gps = DashboardBlock.input.queries.gps.value.split(',')
      var latLng = { lat: parseInt(gps[0]), lng: parseInt(gps[1]) }
      map = new google.maps.Map(document.getElementById('map'), {
        center: latLng,
        zoom: 7,
      })
      var marker = new google.maps.Marker({
        position: latLng,
        map: map,
        title: 'Hello World!',
      })
    }
    DashboardBlock.on('change', drawChart)
  }
</script>
<script
  src="https://maps.googleapis.com/maps/api/js?key=GOOGLE_API_KEY&callback=initMap"
  async
  defer
></script>
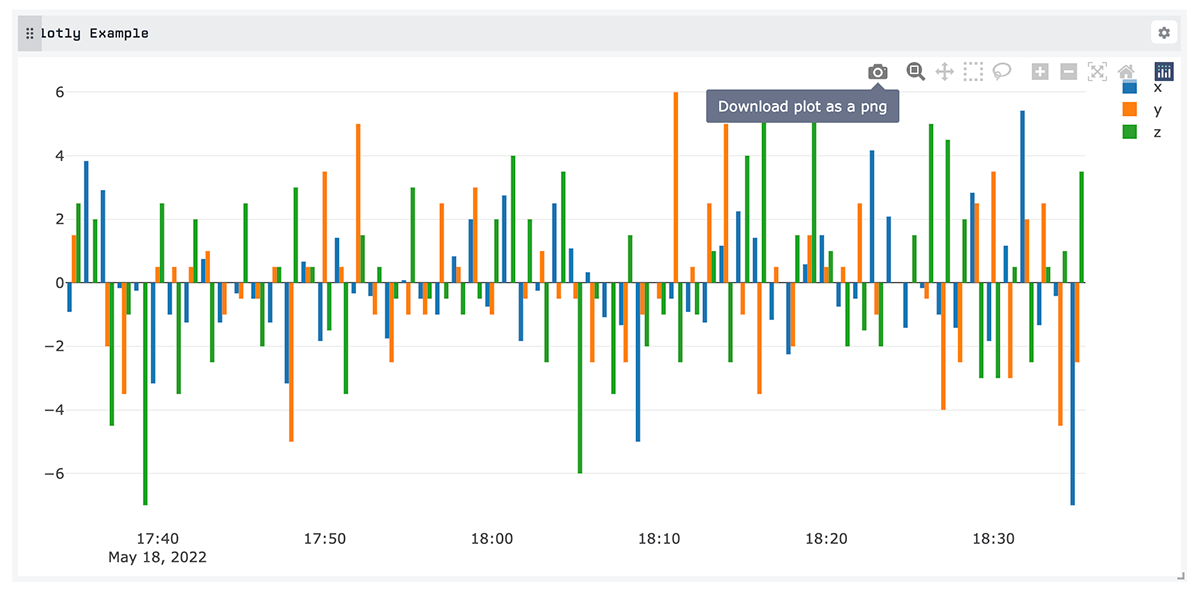
Using Plotly.js
Example Plotly.js Head Content
<script src="https://cdn.plot.ly/plotly-2.12.1.min.js"></script>
<script>
  document.addEventListener('DOMContentLoaded', () => {
    const chart = document.getElementById('plotly-chart');
    const layoutOptions = {
      margin: {
        b: 40, l: 40, r: 20, t: 10
      }
    };
    const configOptions = {
      responsive: true
    }
    DashboardBlock.on('change', ({ queries }) => {
      const newData = Object.entries(queries).map(([queryName, points]) => {
        return {
          x: points.map(({ time }) => time),
          y: points.map(({ value }) => value),
          type: 'bar',
          name: queryName
        }
      });
      if (!chart.data) {
        Plotly.newPlot(chart, newData, layoutOptions, configOptions);
      } else {
        Plotly.react(chart, newData, layoutOptions, configOptions);
      }
    });
  });
</script>
Example Plotly.js Body Content
<div id="plotly-chart" style="height: 100%";></div>
Creating a Connected vs Disconnected Device Chart

Example Google Charts Head Content
<script type="text/javascript" src="https://www.gstatic.com/charts/loader.js"
></script>
<script type="text/javascript">
  google.charts.load('current', { 'packages': ['corechart'] });
  google.charts.setOnLoadCallback(drawChart);

  function drawChart(conCount = 0, disCount = 0) {
    var data = google.visualization.arrayToDataTable([
      ['Connection Status', 'Device Count'],
      ['Connected', conCount],
      ['Disconnected', disCount]
    ]);

    var options = {
      pieHole: 0.3,
      pieSliceText: 'value',
      pieSliceTextStyle: {
        fontSize: 18
      },
      legend: 'none',
      slices: [
        { color: '#8db319' },
        { color: '#ff495c' }
      ]
    };

    var chart = new google.visualization.PieChart(document.getElementById('piechart'));

    chart.draw(data, options);
  }
  DashboardBlock.on('change', ({ queries }) => {
    drawChart(queries.connected.totalCount, queries.disconnected.totalCount)
  })
</script>
Example Google Charts Body Content
<div id="piechart" style="width: 100%; height: 100%"></div>
Creating A Simple Table
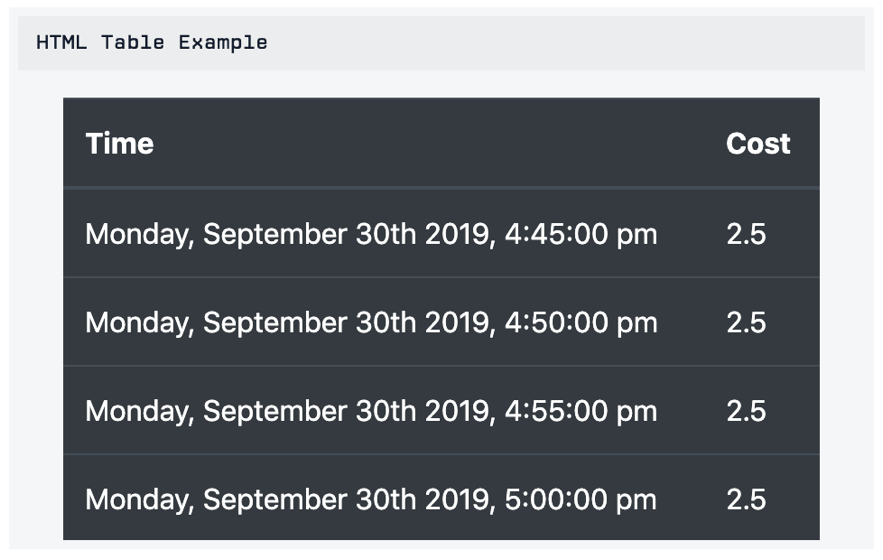
Example Simple Table Head Content
<link
  rel="stylesheet"
  href="https://stackpath.bootstrapcdn.com/bootstrap/4.3.1/css/bootstrap.min.css"
/>
<script src="https://code.jquery.com/jquery-3.3.1.slim.min.js"></script>
<script src="https://cdnjs.cloudflare.com/ajax/libs/popper.js/1.14.7/umd/popper.min.js"></script>
<script src="https://stackpath.bootstrapcdn.com/bootstrap/4.3.1/js/bootstrap.min.js"></script>
<script src="https://cdnjs.cloudflare.com/ajax/libs/moment.js/2.24.0/moment.min.js"></script>
<style>
  body {
    padding: 10px;
    margin: 0px;
    background: transparent;
  }
</style>
<script type="text/javascript">
  function renderBlock(input) {
    if (DashboardBlock.input.queries.cost) {
      $('#table-body').empty()
      // loop through each point and append row to table
      input.queries.cost.forEach(function(point) {
        $('#table-body').append(`
          <tr>
            <td>${moment(point.time).format(
              'dddd, MMMM Do YYYY, h:mm:ss a'
            )}</td>
            <td>${point.value}</td>
          </tr>
        `)
      })
    }
  }

  DashboardBlock.on('queryChange', renderBlock)
</script>
Example Simple Table Body Content
<div class="container-fluid">
  <table id="table" class="table table-dark">
    <thead>
      <tr>
        <th scope="col">Time</th>
        <th scope="col">Cost</th>
      </tr>
    </thead>
    <tbody id="table-body"></tbody>
  </table>
</div>
Creating a Simple Gauge
In this example, we create a version of Losant's "tank" gauge.

- Whenever new gauge query data is received, we change the Y scale (height) of the gauge's fill section based on the received value as compared against a minimum and maximum.
- The color of the fill section also changes based on how close to full the gauge appears.
- We also resize the gauge to fit the block whenever the block resizes.
- We match the gauge container to a color that works well against the user's dashboard theme ("light" or "dark").
Example Simple Gauge Head Content
<meta charset="UTF-8">
<style>
  body { font-size: 0; margin: 0; padding: 0; }
</style>
<script>
  let gaugeEl, fillEl, beakerEl;
  const GAUGE_QUERY_NAME = 'gauge'; // change this to the name of your gauge query
  const GAUGE_MIN = 0;
  const GAUGE_MAX = 10;

const getFillDecimal = (val, min = GAUGE_MIN, max = GAUGE_MAX) => {
    const decimal = (val - min) / (max - min);
    if (decimal < 0) { return 0; }
    if (decimal > 1) { return 1; }
    return decimal;
  };

  const getFillColor = (decimal) => {
    if (decimal > 0.9) { return 'red'; }
    if (decimal > 0.75) { return 'orange'; }
    return 'green';
  };

  const getContainerColor = (e) => {
    return e.dashboard.themeName === 'dark' ? 'gray' : 'silver';
  };

  const getGaugeWidthAndHeight = (blockWidth, blockHeight, viewboxWidth = 136, viewboxHeight = 190) => {
    if (blockWidth / blockHeight > viewboxWidth / viewboxHeight) {
      // height is our limiting factor
      return {
        width: viewboxWidth * blockHeight / viewboxHeight,
        height: blockHeight
      };
    }
    // width is our limiting factor
    return {
      width: blockWidth,
      height: viewboxHeight * blockWidth / viewboxWidth
    };
  };

  const setSize = (e) => {
    const { width, height } = getGaugeWidthAndHeight(e.size.width, e.size.height);
    gaugeEl.setAttribute('width', width);
    gaugeEl.setAttribute('height', height);
  };

  const setFillHeight = (e) => {
    const { value } = e.queries[GAUGE_QUERY_NAME];
    const decimal = getFillDecimal(value);
    fillEl.style.transform = `scaleY(${decimal})`;
    const fillColor = getFillColor(decimal);
    fillEl.setAttribute('fill', fillColor);
  };

  const setContainerColor = (e) => {
    beakerEl.setAttribute('fill', getContainerColor(e));
  };

  document.addEventListener('DOMContentLoaded', () => {
    gaugeEl = document.getElementById('tank-gauge');
    fillEl = document.getElementById('tank-fill');
    beakerEl = document.getElementById('tank-beaker');
    setSize(DashboardBlock.input);
    setContainerColor(DashboardBlock.input);
  });

  DashboardBlock.on('resize', (e) => {
    setSize(e);
  });

  DashboardBlock.on('queryChange', (e) => {
    setFillHeight(e);
  });

  DashboardBlock.on('themeChange', (e) => {
    setContainerColor(e);
  });
</script>
Example Simple Gauge Body Content
<div style="text-align: center">
  <svg id="tank-gauge" xmlns="http://www.w3.org/2000/svg" viewBox="0 0 136 190">
    <defs><clipPath id="clip-path"><rect x="25" width="86" height="175" rx="12" ry="12" style="fill: none" /></clipPath></defs>
    <g style="clip-path: url(#clip-path)">
      <rect
        id="tank-fill"
        transform="translate(0 175) translate(0 -175)"
        style="transition: fill 0.5s ease, transform 0.5s ease; transform-origin: 0 175px;"
        fill="black"
        x="25"
        y="15"
        width="86"
        height="160"
      />
    </g>
    <path
      id="tank-beaker"
      fill="silver"
      d="M136,0H0V10H10V166a24.07,24.07,0,0,0,24,24h68a24.07,24.07,0,0,0,24-24V10h10ZM116,164a16,16,0,0,1-16,16H36a16,16,0,0,1-16-16V10h96Z"
    />
  </svg>
</div>
Fetching Data From an Experience Endpoint
When displaying a dashboard in an Experience Page, it is possible to fetch custom, user-specific data from an Experience Endpoint by utilizing JavaScript's Fetch API.
First, verify that the workflow issuing the Experience User's authorization token and setting it as a browser cookie has the cookie's SameSite property set to "None". This can be done in the Endpoint Reply Node that responds to a successful user authentication request. This step is required since we are making an asynchronous request to an Experience Endpoint from the context of the Custom HTML Block's iframe. Failure to set this property on the user's cookie will result in failed requests.
With that in place, we can make a request to the endpoint like so, and with the Experience User's token included in the request, we know who specifically is making the request and can return a user-specific response in our workflow:
Example Endpoint Fetch Head Content
<meta charset="UTF-8">
<script type="text/javascript">
  let isFetching = false; // we flip this flag to true when a request is in flight
  const fetchUser = async () => {
    let response;
    isFetching = true;
    const endpointUrl = 'https://example.com/endpoint/path'; // replace with the URL to your endpoint
    try {
      response = await fetch(endpointUrl, {
        credentials: 'include' // this is required to pass the authorization token in the request
      });
      response = response.json(); // if your endpoint returns JSON, this will parse the response into an object
    } catch {
      response = null; // can put your own failure case here
    }
    isFetching = false; // the request has completed
    return response;
  }

  // an example of what to do with the response from the API request
  // here, we are simply writing the response object to a <pre> element in our markup
  const setBody = (value) => {
    const element = document.getElementById('userResponse');
    if (element) {
      element.innerHTML = JSON.stringify(value, null, 2);
    }
  }

  const fetchUserAndSetBody = async () => {
    if (isFetching) {
      return; // do not kick off another fetch if one is in progress
    }
    const user = await fetchUser();
    if (user) {
      setBody(user);
    }
  }
  DashboardBlock.on('timeChange', fetchUserAndSetBody); // Kick off the request every time the dashboard's timer turns over
  document.addEventListener('DOMContentLoaded', fetchUserAndSetBody); // Also kick off the request on initial block mount
</script>
Example Endpoint Fetch Body Content
What you do with the response will vary, but to simply display the resulting object in a <pre> tag in the block, the combination of the below HTML and the setBody() function from above will achieve that result:
<pre id="userResponse">
  Loading ... <!-- displayed while the initial request is in flight -->
</pre>
Was this page helpful?
Still looking for help? You can also search the Losant Forums or submit your question there.