Debug Node
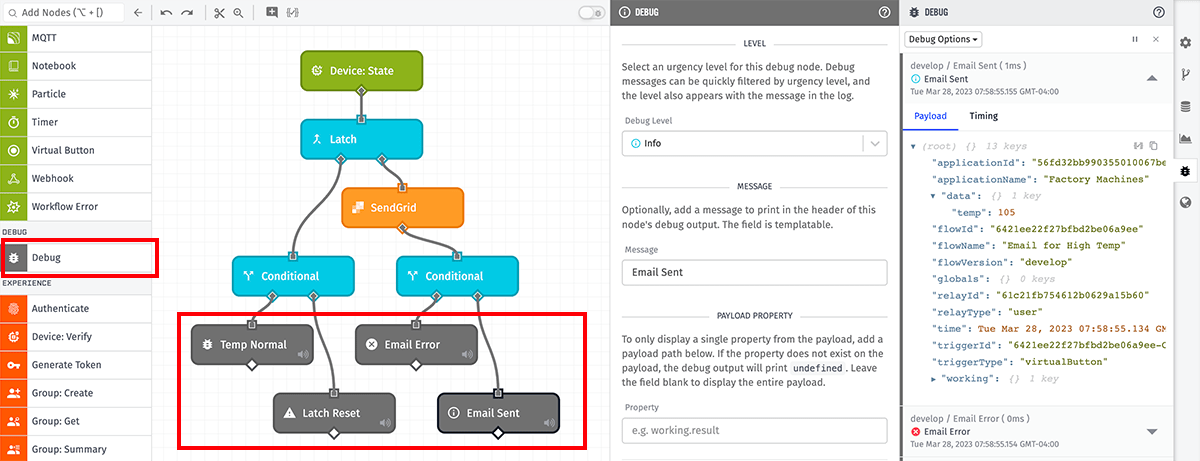
The Debug Node allows inspection of the current payload and execution timing info at any point during a workflow. It is extremely useful when initially constructing a workflow to ensure that all the various components are acting on the payload as expected.
The use of a Debug Node does not alter or mutate your workflow payload in any way. The presence of a Debug Node has no effect on if your workflow runs or the end result.

Node Properties
The Debug Node takes a few configuration properties …
Level
First, choose one of four urgency levels for messages generated by this Debug Node. These levels may be applied as you see fit, but general practice dictates assigning levels by the following criteria:
- Error: The condition cannot be recovered from, but the workflow will continue to run.
- Warning: The condition is a recoverable error that is worth notifying the workflow developer about.
- Info: A unique condition was encountered, but it requires no action.
- Verbose: (default) The output is relevant only during the development process and can safely be ignored.
When viewing your workflow, you may choose which - if any - of these output levels to display in the debug log.
Note: In Edge Workflows, choosing an urgency level is only available in GEA version 1.38.0 and greater.
Message
The Debug Node takes an optional “Message” (a string template) to include in its generated messages. In the above example, the message is “Email Sent”. Users may temporarily filter entries in the debug panel by this property.
Payload Property
The node also allows for only printing a single property from the payload, as defined by a payload path. If the property is defined in the configuration, and that property does not exist on the payload, the debug output will print undefined.
Viewing Debug Output
Whenever a workflow runs, and in the process that run passes through one or more Debug Nodes, the workflow run will be visualized two different ways.
Debug Panel
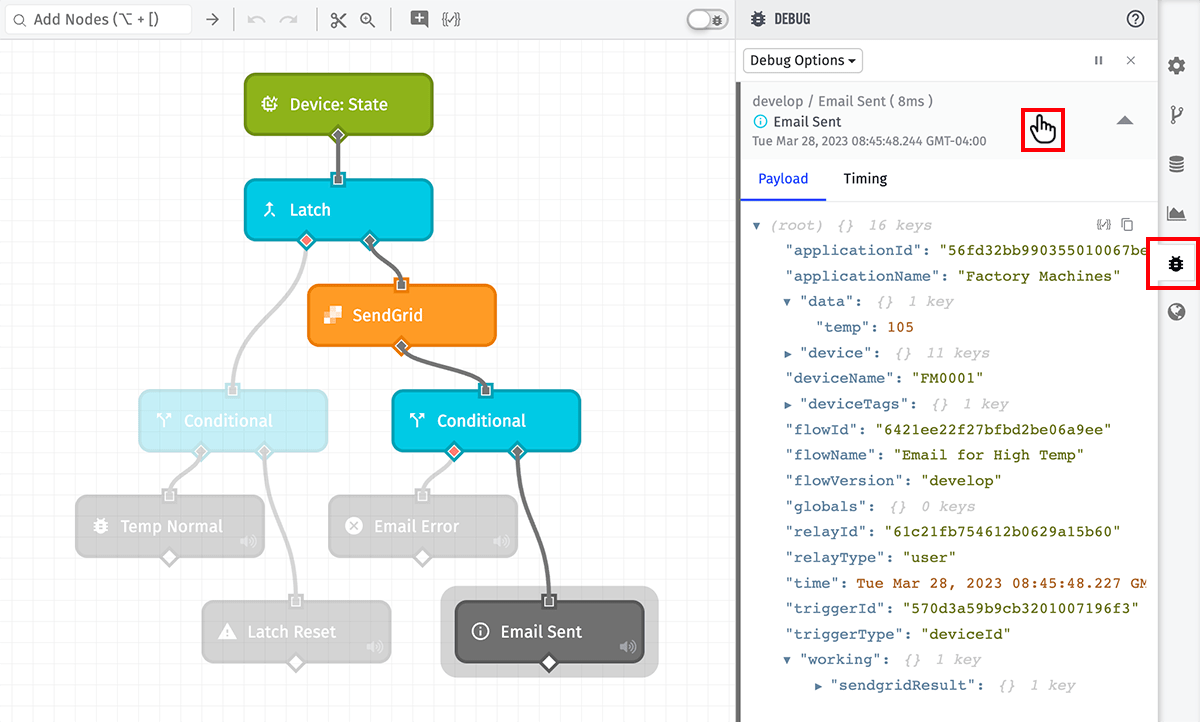
Every time a Debug Node is hit in a workflow run, the following information is printed to the debug log:
- The timestamp of the generated message.
- The flow version that executed.
- The device that ran the flow version (for Edge Workflows and Embedded Workflows).
- The node that generated the message, including its level and message.
- The full payload (or the chosen property value) at the time the node executed.
- The timing statistics for all nodes the preceded the Debug Node in the run.
New messages appear at the top of the list. If multiple Debug Nodes are hit as part of a single workflow run, each Debug Node will get an entry in the panel; this can be helpful in determining how your payload changes over the course of a run.
Note: In order to see the debug output for Edge Workflows and Embedded Workflows, you’ll need to use the Live Look for a specific device.

To view that payload’s path through the workflow run, hover your mouse over the debug message. You will see the nodes that were part of the run highlight, and the Debug Node that generated the message will be called out.
For more information on utilizing the debug panel, visit our debugging workflows documentation.
Live Stream
Optionally, you may also enable the Live Debug Stream by clicking the button in the top right corner of the workflow stage. When live streaming is enabled, you will see workflow runs highlight in real time as they fire.

Note: Should multiple workflow runs occur per second, some of the runs may not be visualized on the stage. Also, if you have unsaved changes in your workflow, live streams will automatically be disabled until the changes are saved.
Muting Individual Debug Nodes
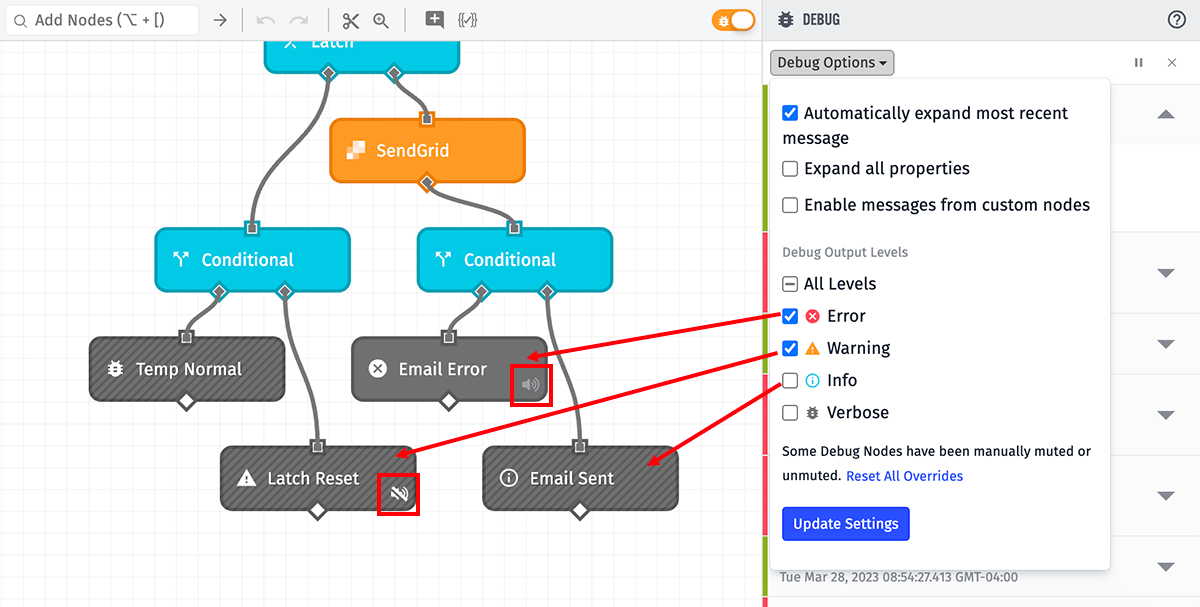
Opening the Debug Options menu allows you select or unselect the debug output levels that will appear in the debug log. If a Debug Node’s given level is not selected, that node will appear on the stage as disabled. In these cases, messages will not be generated for this Debug Node.

If a Debug Node’s level is being displayed in the log, you may optionally mute that specific node by clicking the “Mute” icon in the bottom-right corner of the node on the stage. Doing so will cease outputting that node’s messages to the log. This setting is temporary and will reset when you refresh your web browser or return to the page later; muting the node does not save that setting to the workflow.
If any nodes have been manually muted or unmuted, the Debug Options menu will display a “Reset All Overrides” option that will reset all nodes’ mute status based on the selected Debug Output Levels.
Also, like choosing the debug log’s output level, muting a node does not affect other users who may be consuming the workflow’s debug stream.
Was this page helpful?
Still looking for help? You can also search the Losant Forums or submit your question there.
