Indicator
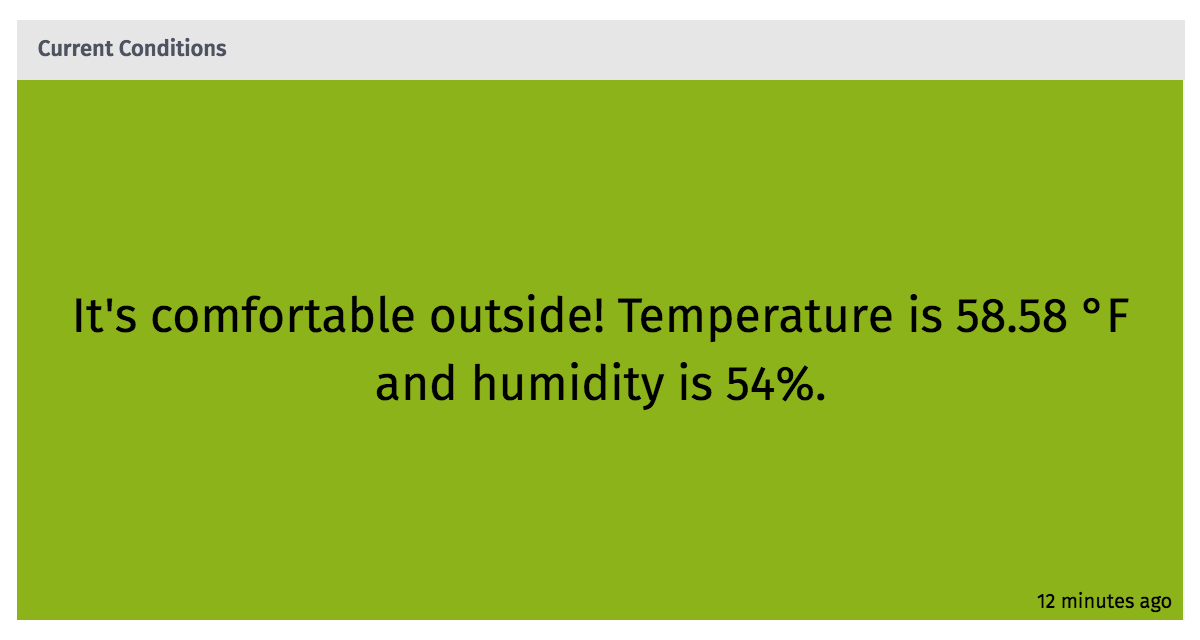
The Indicator Block displays a color and message of your choosing based on the result returned from a gauge query.

Query Configuration
Data Type

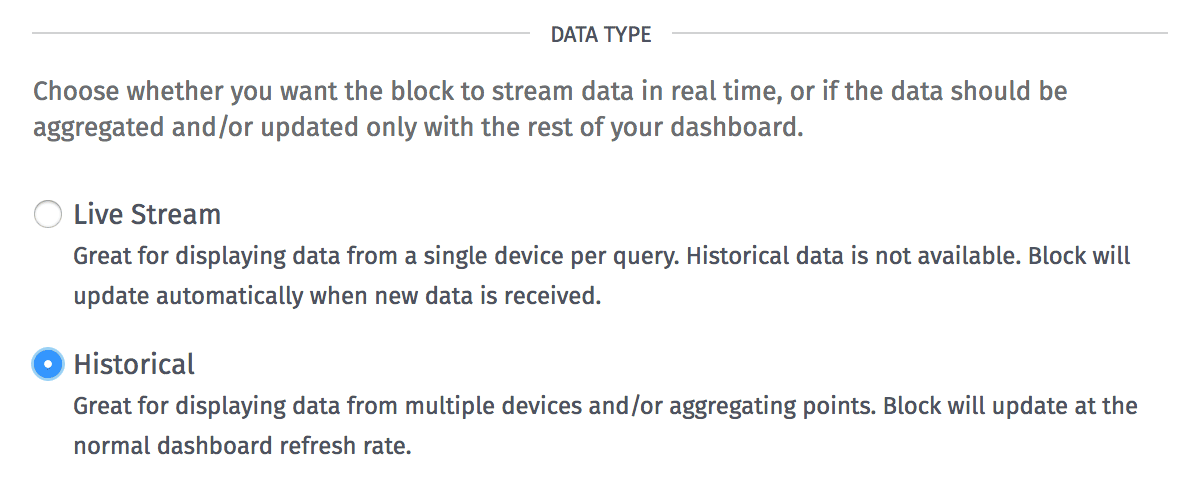
The Indicator Block can display points as a live stream (re-rendering the block every time a data point hits the platform) or as a historical block. Each style has its own advantages:
- Live stream blocks provide feedback with more immediacy than historical blocks, as they do not require a dashboard data refresh to populate with new data. If one of the block’s segments references multiple devices by ID or tag, the block will update anytime any of those devices reports state for the chosen attribute. For this reason we recommend one device per segment when building live stream blocks.
- Historical charts allow for data to be aggregated according to a number of rules (based on time durations, mathematical functions and the combination of data from multiple sources), and they also allow for viewing past dashboard states.
Duration
To view the current state of your device(s), select “Last received data point”. To view an aggregation of your data over a given time period, choose any other value. This option is removed when “Live Stream” is selected for the block’s data type.

Queries
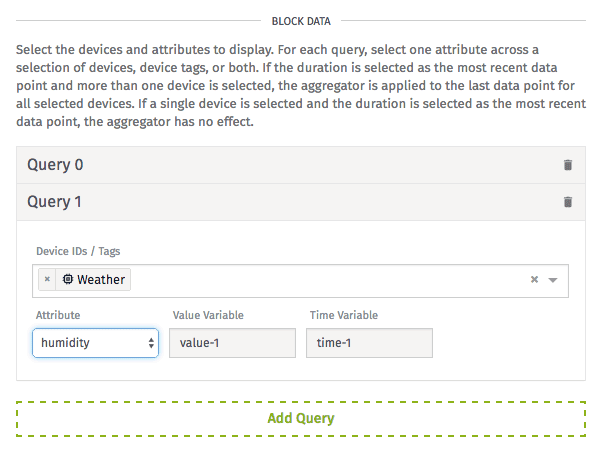
It is possible to build multiple data queries into your indicator block, and the result of each query will be available when writing conditions and displaying data. Each must have at least one device or one device tag selected, along with one attribute from which to return data.

When “Historical” is selected as the block type, and either a duration other than “Last received data point” is selected or more than one device is selected or at least one device tag is selected within a query, it will also be necessary to select an aggregation method for that query. This is the mathematical operation by which your query will boil down all data from the selected devices and duration into a single value. The default aggregation method is Mean.
Query Result
The current query values are displayed beneath the query configuration, which can be used to verify the query configuration is correct. For each query, there are two variables returned, which can be accessed via Handlebars string templates and expressions:
value-i, which is the result of the query if a result is returned. Depending on the query’s construction and the attribute type, the result’s type can take one of many forms. (See below.)time-i, which is a JavaScript Date object representing the time the value was reported. If the value is being aggregated, this will always be equal to the dashboard’s last refresh time; otherwise, it will be equal to the time the queried device last reported state.
In the two examples above, i represents the index of the query. The full variable name is printed along with each query configuration.
Another variable can be referenced no matter how many queries return data: lastUpdated, which is the latest time any of the queries returned a value. A human-readable “from now” version of this variable is printed in the bottom left corner of the block.
Depending on the type of attribute selected, the query’s value can return data of varying types …
Number Attributes
Numbers are the easiest attribute type to work with as, no matter the aggregation method, they will always return a number.
Boolean Attributes
If querying for the last received data point of a boolean attribute for a single device, the result will return as true or false.
If the boolean attribute is being aggregated – as the result of a query across multiple devices or a larger duration – then all false points will be treated as a 0 and all true points will be treated as a 1. Then, the result will return as a number representing the following:
Countwill return as a whole number greater than or equal to 0, which is equal to the total number of data points across the query.FirstandLastaggregations will return astrueorfalse.MinandMaxaggregations will return as0(false) or1(true).Meanaggregations will return as a number between 0 and 1 (inclusive), which is the average of all data points across the query.Sumwill return as a whole number greater than or equal to 0, which is equal to the number oftruedata points across the query.Standard Deviationaggregations will return as a number between 0 and 1 (inclusive), which is the amount of variation or dispersion of all data points across the query.Medianaggregations will return the number in the middle of the ordered data set.Time At Valueaggregations return the total time (in milliseconds) that an attribute equals a value in a given range of time. For multiple devices, the total time is averaged.
GPS and String Attributes
When requesting the last received data point of a single device, the result will return as a string.
When requesting aggregated data for such an attribute …
FirstandLastaggregations will return the first or last data point collected across the query.Countaggregations will return as a number representing the total number of data points across the query.Time At Valueaggregations return the total time (in milliseconds) that an attribute equals a value in a given range of time. For multiple devices, the total time is averaged. This method is not valid for durations of zero (e.g. Systems).- All other queries will return as
undefined.
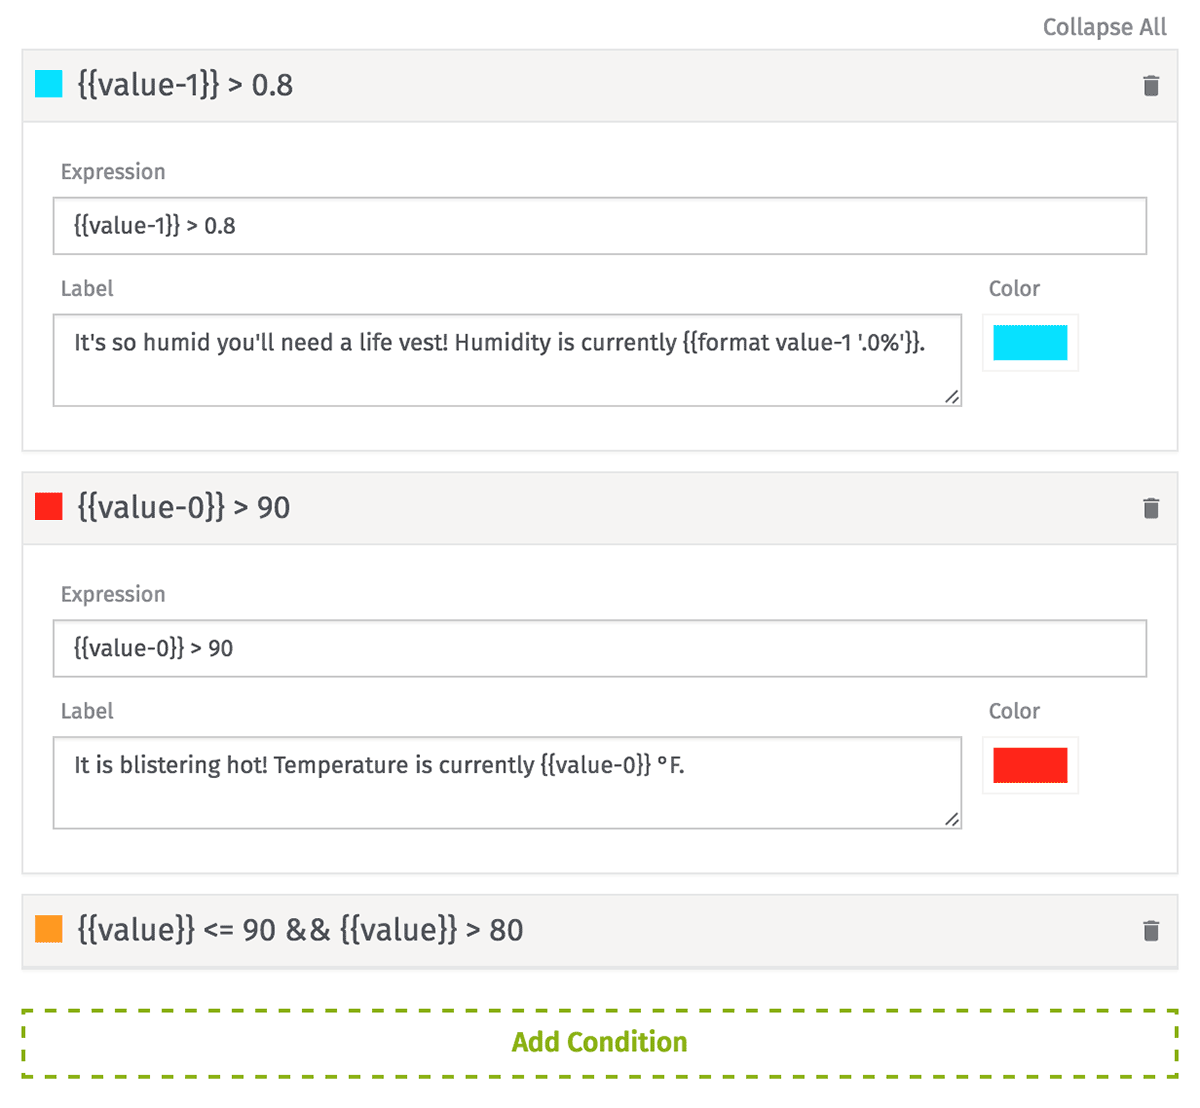
To expand a condition for editing, simply click the header. You can also choose to expand or collapse all conditions by clicking the link at the top right corner of the section.
Conditions
When a query returns a result, that result is evaluated against all the set conditions, starting with the top-most item in the list. The first condition that returns true has its corresponding label and color displayed within the indicator block.

Creating Conditions
You may set as many conditions to test the result against as you wish. New conditions can be added by clicking the “Add Condition” button, and the conditions can be reordered by dragging and dropping them up and down the list. Conditions can also be removed by clicking the “Delete” icon to the right of each panel’s title.
Condition Configuration
Each condition takes three parameters:
- Expression: The expression to evaluate. All of your query values (e.g.
{{value-0}}and{{value-1}}) and times (e.g.{{time-0}}and{{time-1}}), the{{lastUpdated}}variable, and all Context Variables are available to compare against one another or against a static value. - Label: The text to display within the indicator block. This field is optional, and may include string templates formatting your query variables as well as Markdown. The color of the text will automatically switch between black and white depending on the block’s chosen background color.
- Color: The background color of the indicator block. Default is green.
Default Condition

If none of the set conditions return true, the indicator block will display a default label and color. Configuration is the same as for a condition, except no expression is set.
Was this page helpful?
Still looking for help? You can also search the Losant Forums or submit your question there.
